Solana is back in breakout mode. The high-speed blockchain surged to $167 this week—its highest level since May 29—as trading volume soared, network activity exploded, and investor appetite for Solana-focused ETFs intensified. With transactions outpacing Ethereum, meme coins doubling in market cap, and a golden technical setup forming, Solana is once again commanding center stage in the crypto rally.
Solana’s (SOL) rally occurred in a high-volume environment, with the 24-hour figure jumping to over $6.17 billion.
As the overall industry’s market capitalization exceeds $3.6 trillion, the number of Solana transactions in the network increased by 32% over the last seven days to 590 million. Its transaction count was much higher than other top blockchains like Ethereum (ETH), Binance Coin (BNB), and Sui (SUI), combined.
Solana’s active addresses jumped by 5.3% to 24.3 million, while the amount of fees generated jumped by 44% to $7.6 million. Its 30-day transaction count soared to over 2.1 billion.

Meanwhile, the recently launched REX-Osprey SOL + Staking ETF continues gaining traction among investors as its assets have jumped. Its assets stood at over $72 million by Thursday, a good amount for a two-week ETF.
The main benefit for the SSK ETF is that it offers an exposure to Solana and its accompanying staking rewards. StakingRewards data shows that Solana stakers receive a yield of about 7.5%.
Solana also jumped as its ecosystem did well, with its meme coins gaining traction. The market capitalization of all these coins has jumped to over $12.4 billion from the April low of $6 billion.
Further, Solana’s stablecoin supply stood at $10.7 billion, while its addresses pumped by 15% to 3.4 million. The number of transactions and adjusted volume rose by 29% and 45%, respectively.
Solana price technical analysis

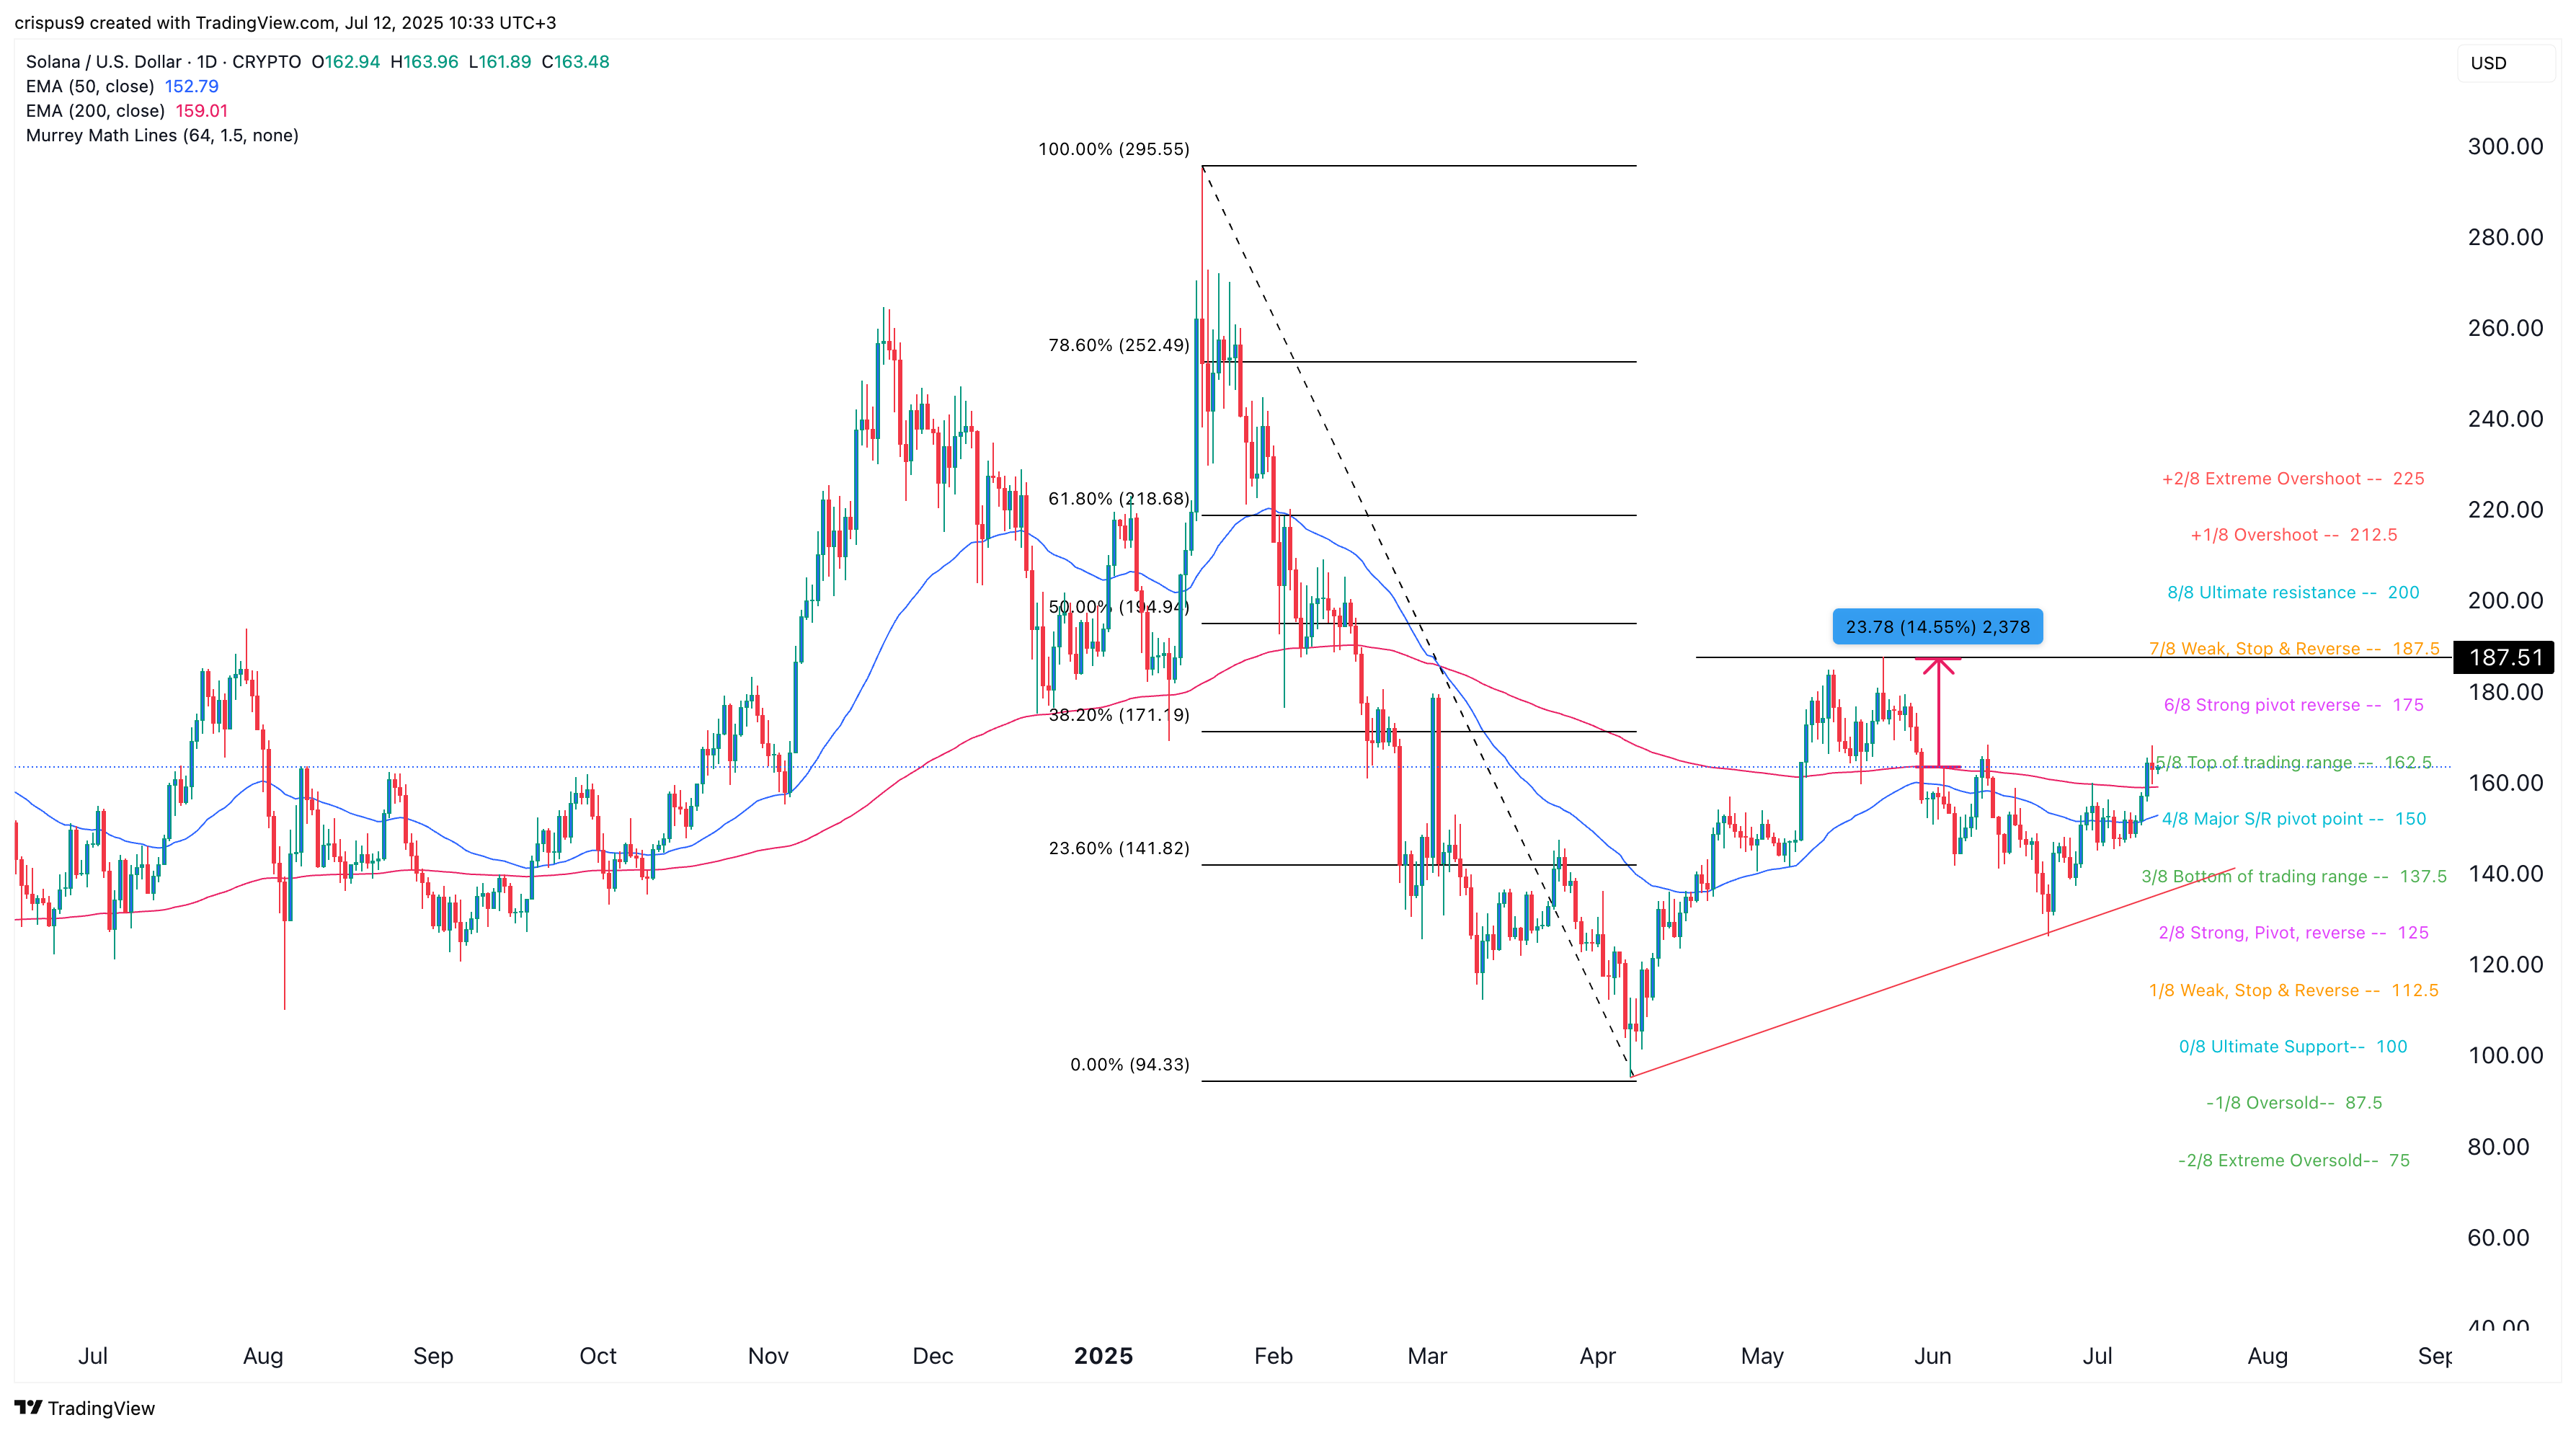
The daily timeframe chart shows that the SOL price bottomed at $94.3 in April and then bounced back. It moved to the top of the trading range of the Murrey Math Lines at $162.
The Solana price jumped above the 50-day and 200-day moving averages, as well as the 23.6% Fibonacci Retracement level. It has also moved above the ascending trendline that connects the lowest point in April and June.
Therefore, the token will likely continue rising as bulls target the key point at $187, the highest point in May. This target is about 15% above the current level. A break above that level will point to more gains, potentially to the Murrey Math Lines ultimate resistance at $200.


