


Dogecoin price remains in a technical bear market after falling by 55% from the highest level in November last year. Technicals and derivative market data point to more downside in the coming days.
Summary
- Dogecoin price could be at risk as demand in the futures market drops.
- The futures open interest has dropped by almost 40% from its highest point in July.
- DOGE has formed a bearish pennant pattern on the three-day chart timeframe.
Dogecoin (DOGE) price was trading at $0.2200 on Aug. 27 as it continues to underperform popular coins like Ethereum (ETH) and Bitcoin (BTC) that are hovering close to their all-time high.
Derivatives data point to weak Dogecoin demand
Dogecoin demand has slumped in the past few weeks. This could be because investors are focusing on Ethereum, Bitcoin, and other top-performing coins. Also, it could be because Dogecoin lacks a clear catalyst to boost its performance.
CoinGlass data shows that DOGE’s futures open interest has been dwindling since July. It recently peaked at $5.3 billion on July 22 and has now fallen by almost 40%.
Futures open interest is an important metric that tracks outstanding futures contracts that are open and not settled or closed. Falling open interest is a sign of low demand and liquidity.
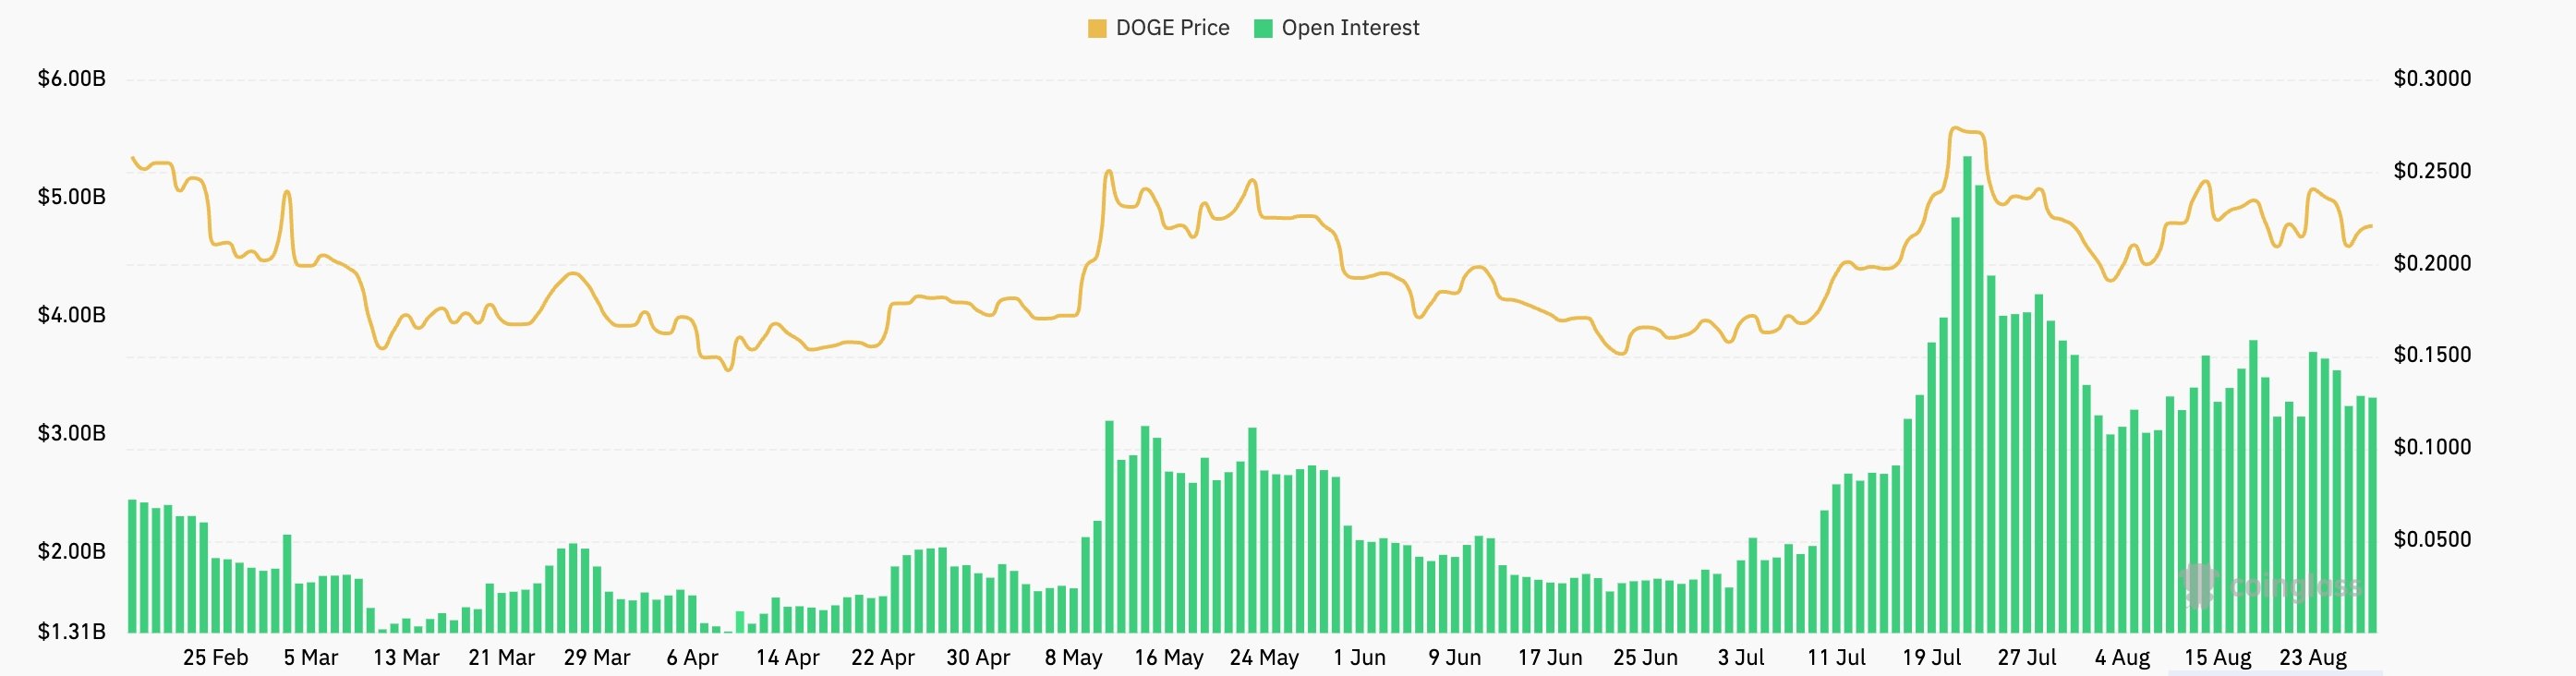
Another sign of low Dogecoin demand is the current volume in the derivatives market. CoinGlass data show that the volume traded today stood at $4.7 billion, down from last month’s high of $14.5 billion.
Dogecoin price technical analysis
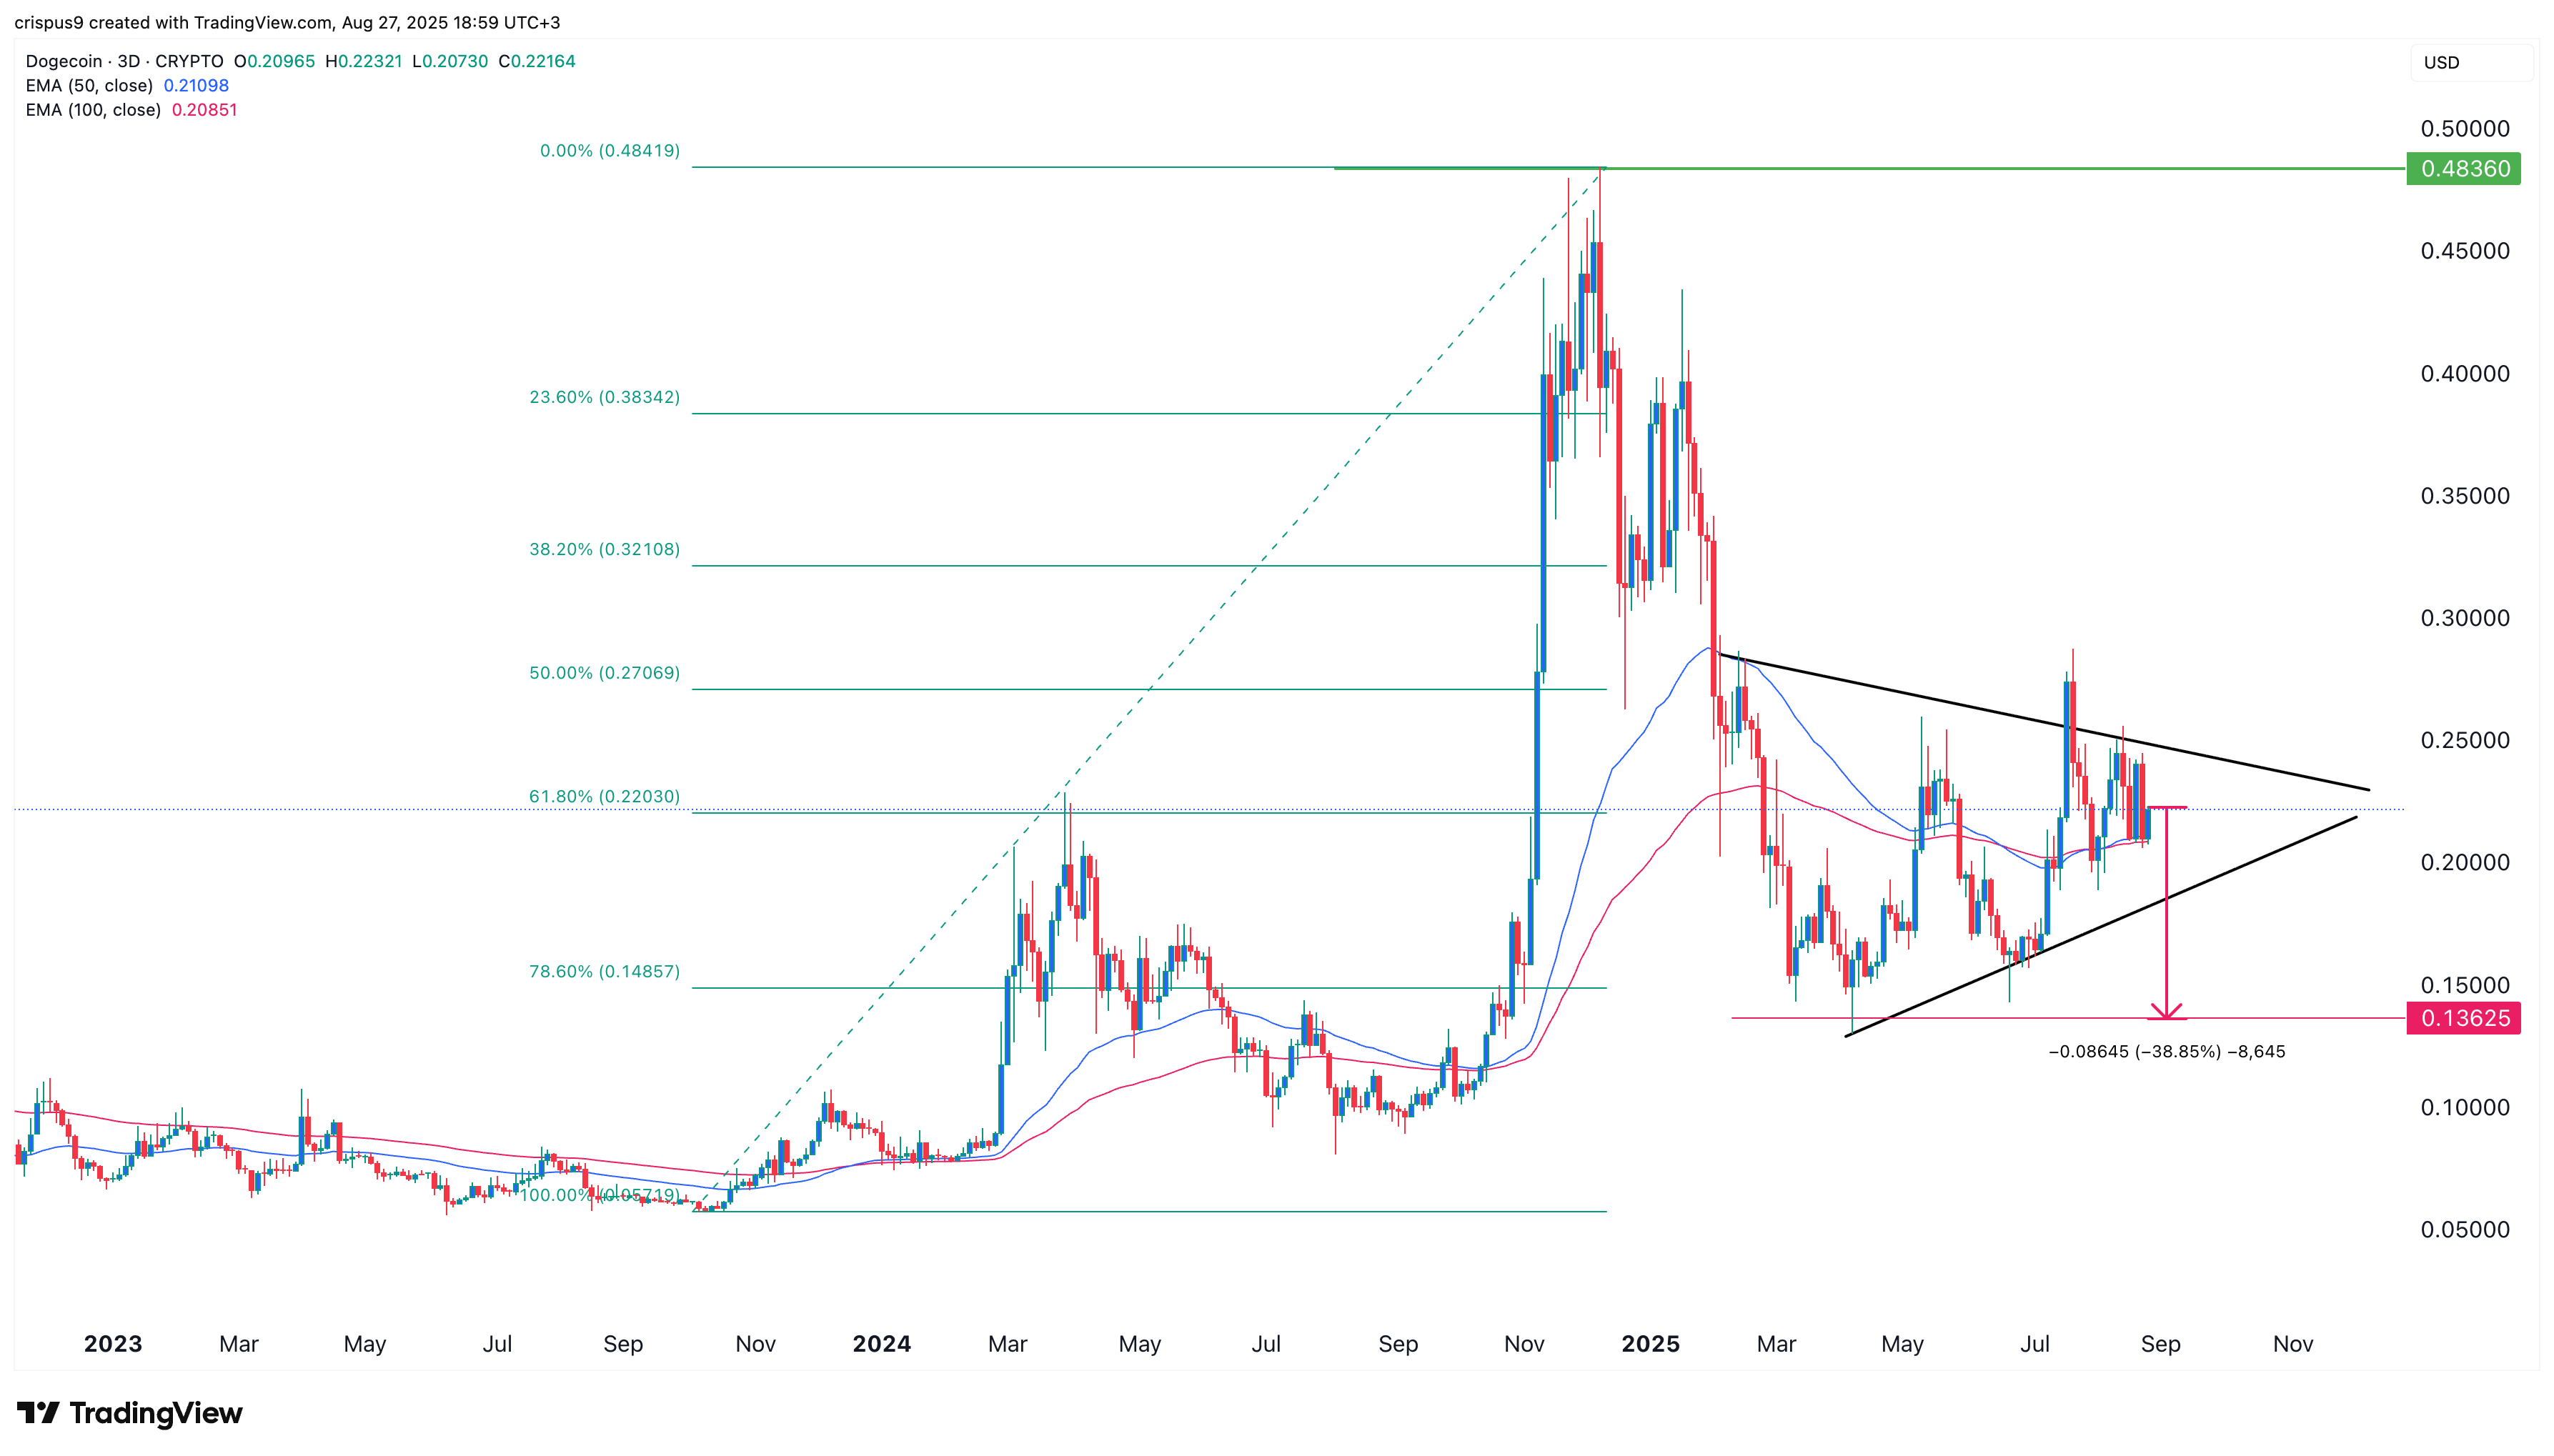
The three-day time frame chart shows that the DOGE price could be at risk of more downside, potentially to the year-to-date low of $0.1360.
Dogecoin price is slowly forming a symmetrical triangle whose two lines are about to converge. The lower line connects the lowest swings since April, while the upper trendline links the highest level in February and August.
This triangle pattern is forming after the coin dropped from the November high of $0.4935, meaning that it is part of a bearish pennant pattern.
Dogecoin is also hovering at the 61.8% Fibonacci retracement level and the 50-day and 100-day exponential moving averages.
Therefore, the most likely DOGE price forecast is where it crashes to the year-to-date low of $0.1362, which is about 40% below the current level.
On the other hand, a move above the upper side of the triangle will invalidate the bearish Dogecoin forecast.