


Bitcoin trades near $91K, trapped between $84K support and $112K resistance, as traders watch for the next major price move.
Bitcoin is trading within a defined range as market participants monitor two key levels. The current price is $91,000, showing a small gain over the past 24 hours and an almost 10% rise over the past week (CoinGecko).
Despite the recent upward trend, BTC remains capped below resistance, with strong support sitting lower in the chart.
Key Price Levels Shaping Bitcoin’s Range
On-chain data reviewed by Ali Martinez suggests that Bitcoin is caught between two high-activity zones. Around $84,570, roughly 610,635 BTC were last moved. This level reflects a large volume of past transactions, indicating strong buying interest that may help hold the price during downward moves.
For Bitcoin $BTC, $84,570 is the support that matters, and $112,340 is the ceiling to watch. pic.twitter.com/rI0dhCgiMK
— Ali (@ali_charts) November 27, 2025
At the higher end, $112,340 is considered the next major level at which supply may return to the market. Approximately 576,252 BTC were last traded near this price. A smaller cluster near $104,765, with over 402,000 BTC moved, may offer additional resistance before any approach to $112K.
Resistance at $91,772 and Momentum Outlook
Bitcoin has been testing the area just below $91,800. This zone has held firm as a short-term cap, preventing further upside. Analyst Michaël van de Poppe said,
“BTC needs to break this crucial level.”
Momentum has returned after the recent bounce from the $82,000 region. However, without a clean break above the current ceiling, the price direction remains uncertain. Key levels to monitor if the trend continues include $107,260 and $111,918.
You may also like:
Moreover, Lennaert Snyder observed that Bitcoin is compressing near the $93,000 resistance. He explained that if this level breaks, the price could head to $95,480. If rejected, a move back toward $90,000 or even $87,800 may occur.
“If we lose $90,000 support, shorts to ~$87,800 are triggered,” he added.
Snyder also noted that $87,800 could act as another support for long entries if the price finds stability there. The compression near $93,000 indicates that a clear directional move could be coming soon.
Network Activity Signal Moves Ahead
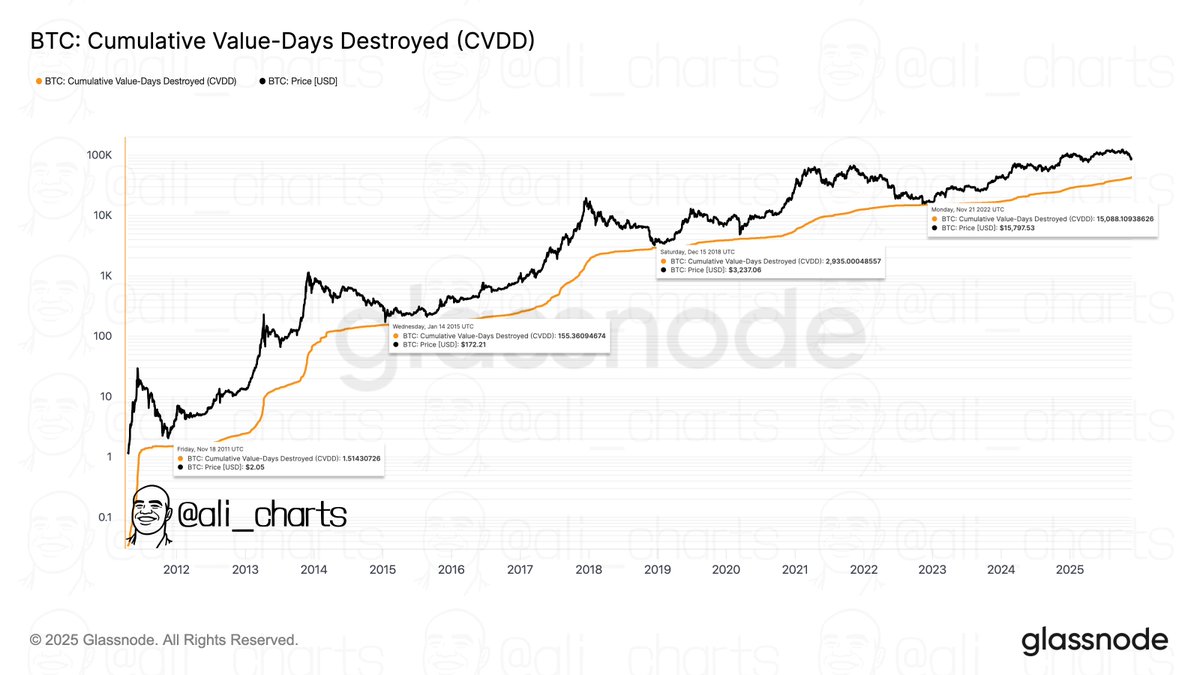
Additionally, Martinez also referred to the CVDD metric as a guide for identifying market bottoms. The model tracks when older units are moved, giving insight into potential cycle lows. Past data shows it has been close to the actual bottom during earlier downturns.
“The CVDD has a solid track record of helping identify terminal bottoms,” he explained.
Elsewhere, Daan Crypto Trades pointed to rising global liquidity as a possible driver. The Global Liquidity Index, which turned higher this week, may support stronger price action if the trend continues.
SECRET PARTNERSHIP BONUS for CryptoPotato readers: Use this link to register and unlock $1,500 in exclusive BingX Exchange rewards (limited time offer).