


 Boosts User Engagement Using XRP for Instant Social Transactions")

TL;DR
- AAVE is holding above range lows with traders watching for a breakout toward $600.
- Daily chart shows an M-pattern forming, with a possible short-term target near $230.
- Balance of Power remains negative, but fading red bars suggest weakening selling pressure.
Price Action and Current Structure
Aave (AAVE) was trading around $290 at press time, with a slight gain of 1% over the last 24 hours. The asset has pulled back by nearly 10% over the past week. At present, AAVE is consolidating just below the mid-range zone between $320 and $340.
CryptoAmsterdam has shared a weekly chart showing that AAVE is holding above its earlier range low entries. It also outlines a recent higher high, and the current consolidation may be forming a higher low. A break above mid-range could push AAVE toward the $600 range high, where traders would then look for a possible breakout into new levels.
// $AAVE
> Consolidating below the mid-range
> Still one of my DeFi/Stablecoin narrative spot bets
> Holding on to my entries at the range lows
> Aiming for the range high zone, then into price discovery. https://t.co/Ggif6Er8pv pic.twitter.com/2IMm9prJ5o— CryptoAmsterdam (@damskotrades) August 20, 2025
Over the last few years, AAVE has moved through several phases. After a strong rally, it entered a deep decline, followed by a long period of sideways movement between $50 and $120. The move out of that range shows a possible shift away from accumulation.
Aave is a major protocol in the DeFi space. It runs a non-custodial lending system and continues to hold a large portion of the market. Based on DefiLlama data, Aave’s Total Value Locked (TVL) is currently at around $36 billion, which makes up close to half of the entire DeFi lending market. Last week, its TVL reached $40 billion, marking a new all-time high.
Bearish Setup on Short-Term Chart
On the daily chart, analyst Ali Martinez pointed to a possible double top forming. This M-shaped pattern often points to a short-term top. If the pattern plays out entirely, AAVE could drop toward $230.
The asset recently dropped to $285.89, after failing to move past the $330 level. Support around $278 is being watched. If that level breaks, the following zones to watch are near $250 and $244.
Moving Averages and Volume Signal
AAVE is now trading above the 20-day simple moving average (SMA) at $288, but just under the 50-day SMA, which is at $294. This shows that the short-term trend is undecided. Buyers will need to hold above $288 and push through the $294 area to regain momentum.
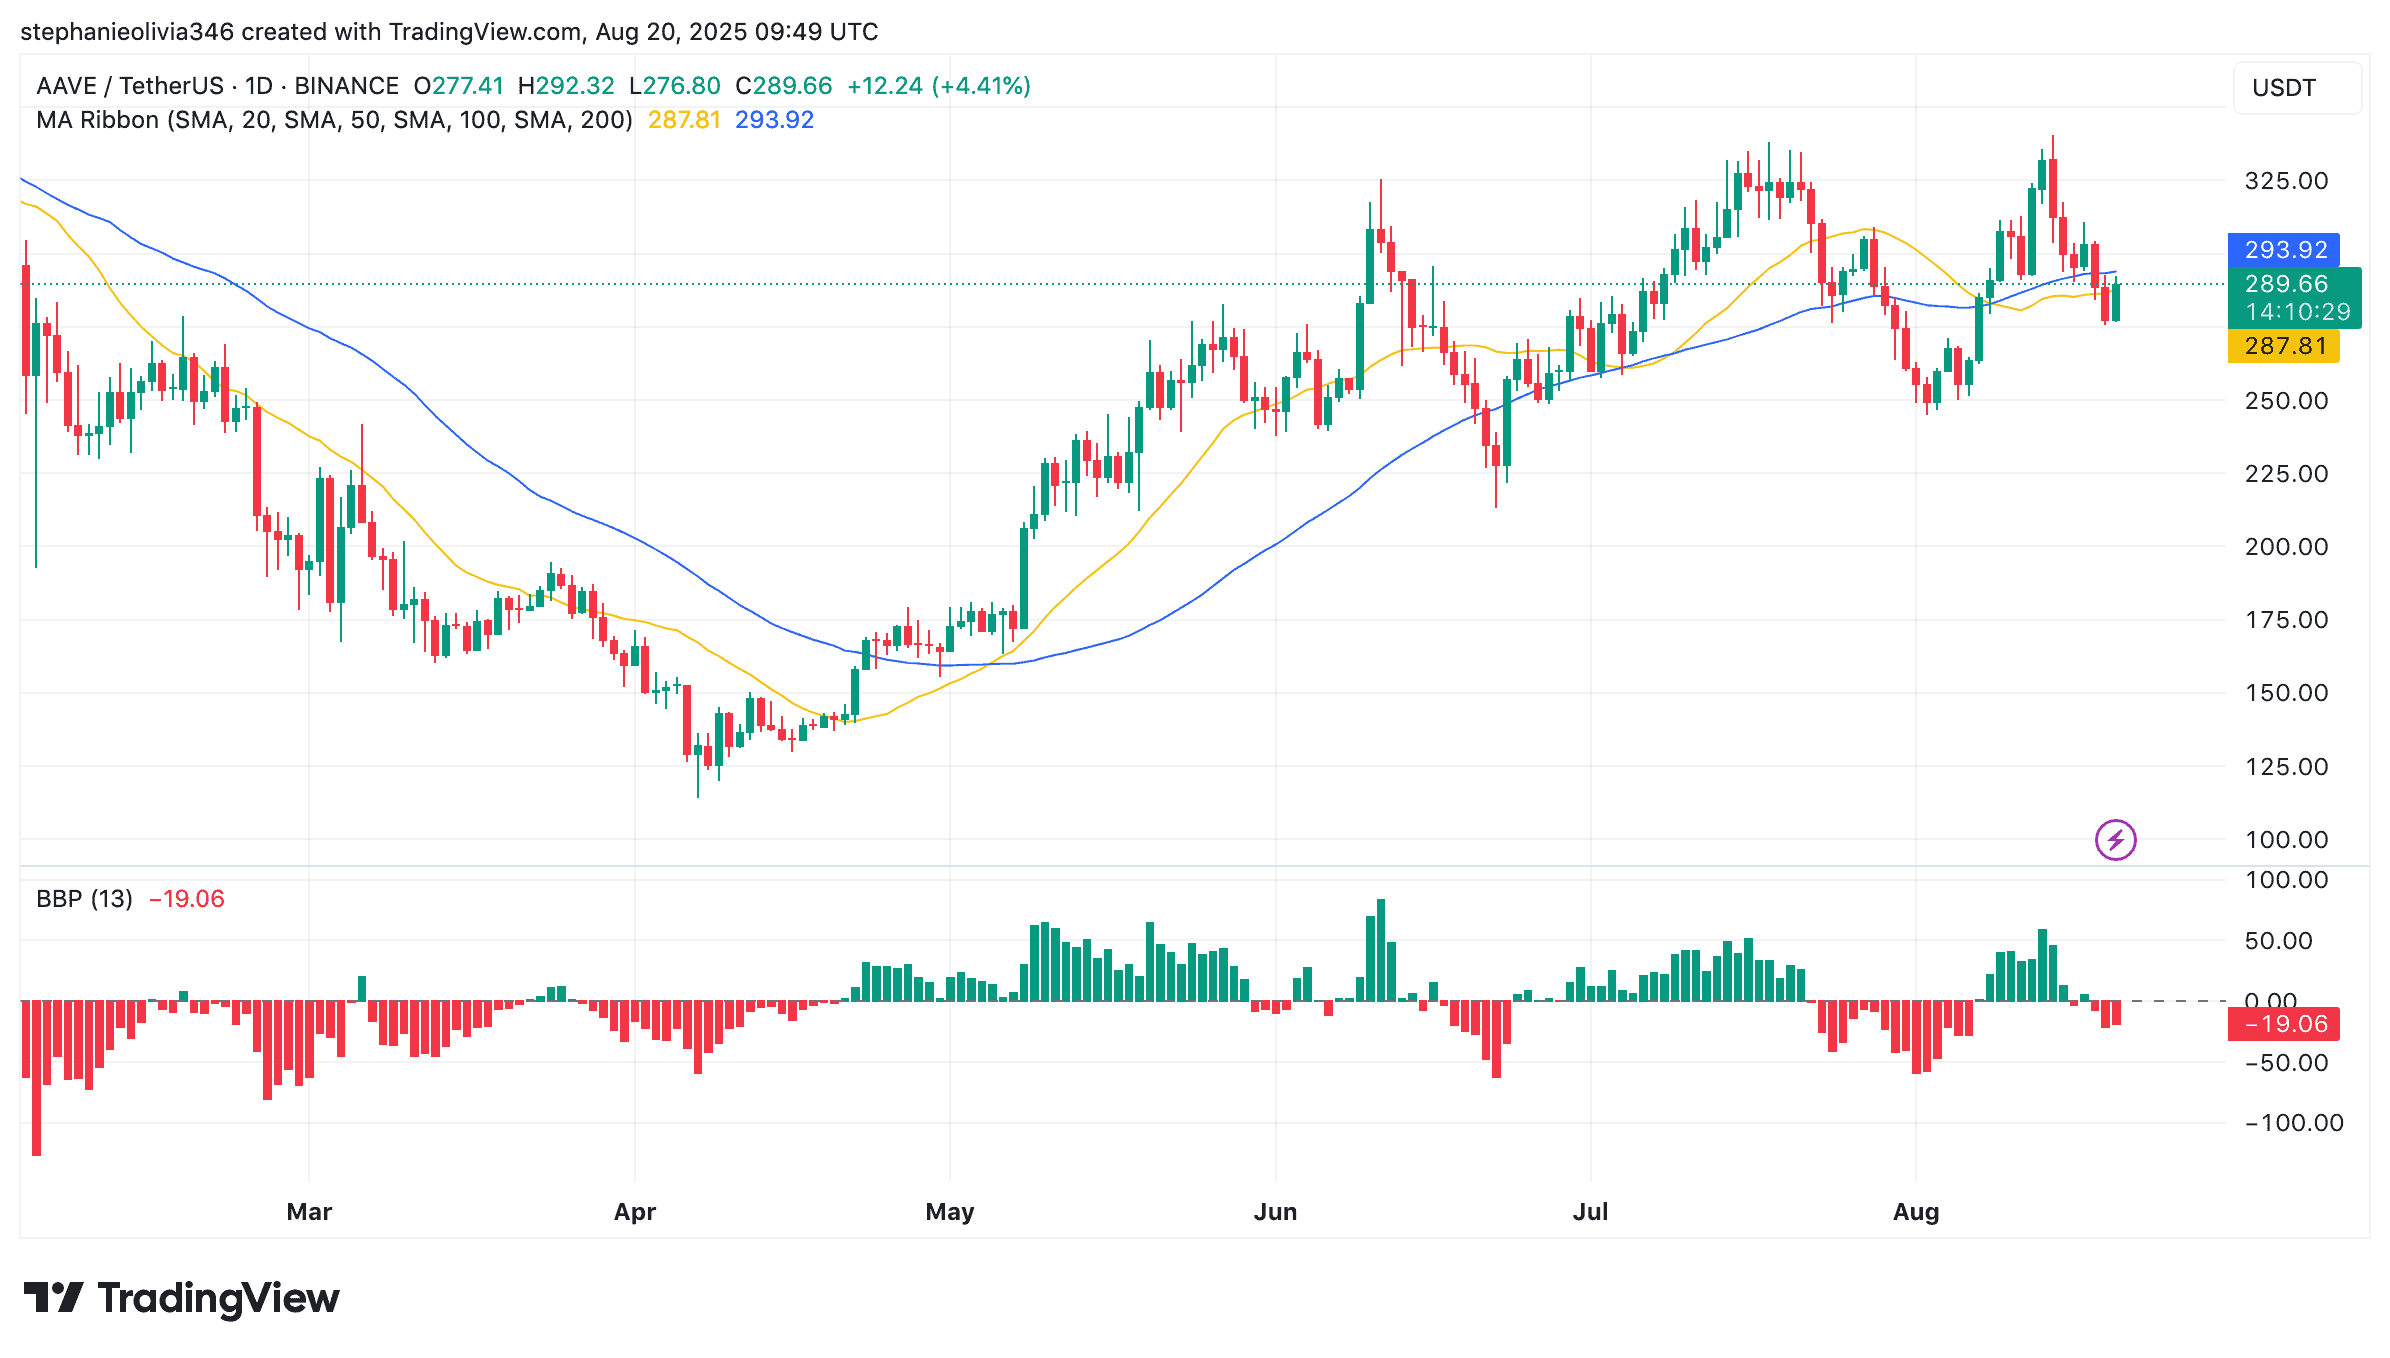
Meanwhile, the Balance of Power (BBP) indicator is at -19.09, showing that sellers still have control. The red bars are smaller than last week, which may suggest that the pressure is fading. Traders are watching for a flip back into positive, which could confirm a recovery if resistance breaks.
Binance Free $600 (CryptoPotato Exclusive): Use this link to register a new account and receive $600 exclusive welcome offer on Binance (full details).
LIMITED OFFER for CryptoPotato readers at Bybit: Use this link to register and open a $500 FREE position on any coin!