 Integrates Grok Models to Advance Creator Personalization")

 Enhances Blockchain Utility with XRP Ledger Integration")

TL;DR
- Long-term Bitcoin holders show heavy activity, historically seen near market tops or correction periods.
- Whale balances drop to levels last seen in 2018, suggesting continued quiet distribution.
- Bitcoin breaks multi-week downtrend, but profit-taking and whale exits raise short-term caution.
Long-Term Holders Begin Moving Coins
Recent data shows that wallets holding Bitcoin for long periods have started to move their BTC. This is tracked through the Long-Term Holder Binary Spending Indicator, which is now showing increased activity from these older wallets. In the past, similar spikes have taken place near price peaks and before broader corrections.
WHALES ARE DUMPING #BITCOIN, A SIGN OF TROUBLE AHEAD?
A key on-chain indicator, the long-term holder binary spending indicator, shows old Bitcoin whales are beginning to sell their holdings.
Historically, these movements have preceded major market corrections, signaling a… pic.twitter.com/c3Xx78Up9v
— Bitcoinsensus (@Bitcoinsensus) September 3, 2025
Bitcoin is currently trading near local highs. Market watchers note that the timing of this behavior may be linked to expectations around potential policy changes by the Federal Reserve. As shared by Bitcoinsensus,
“whales might be anticipating a market-wide correction once the Fed begins cutting rates.”
The pattern is being closely watched, given its history of aligning with key turning points in BTC’s price.
Notably, Bitcoin’s net realized profit and loss data show that many holders have been selling at a profit. July and August saw multiple spikes in realized gains, which took place during price increases. These periods match recent highs in the market and suggest holders may have been reducing exposure as prices climbed.
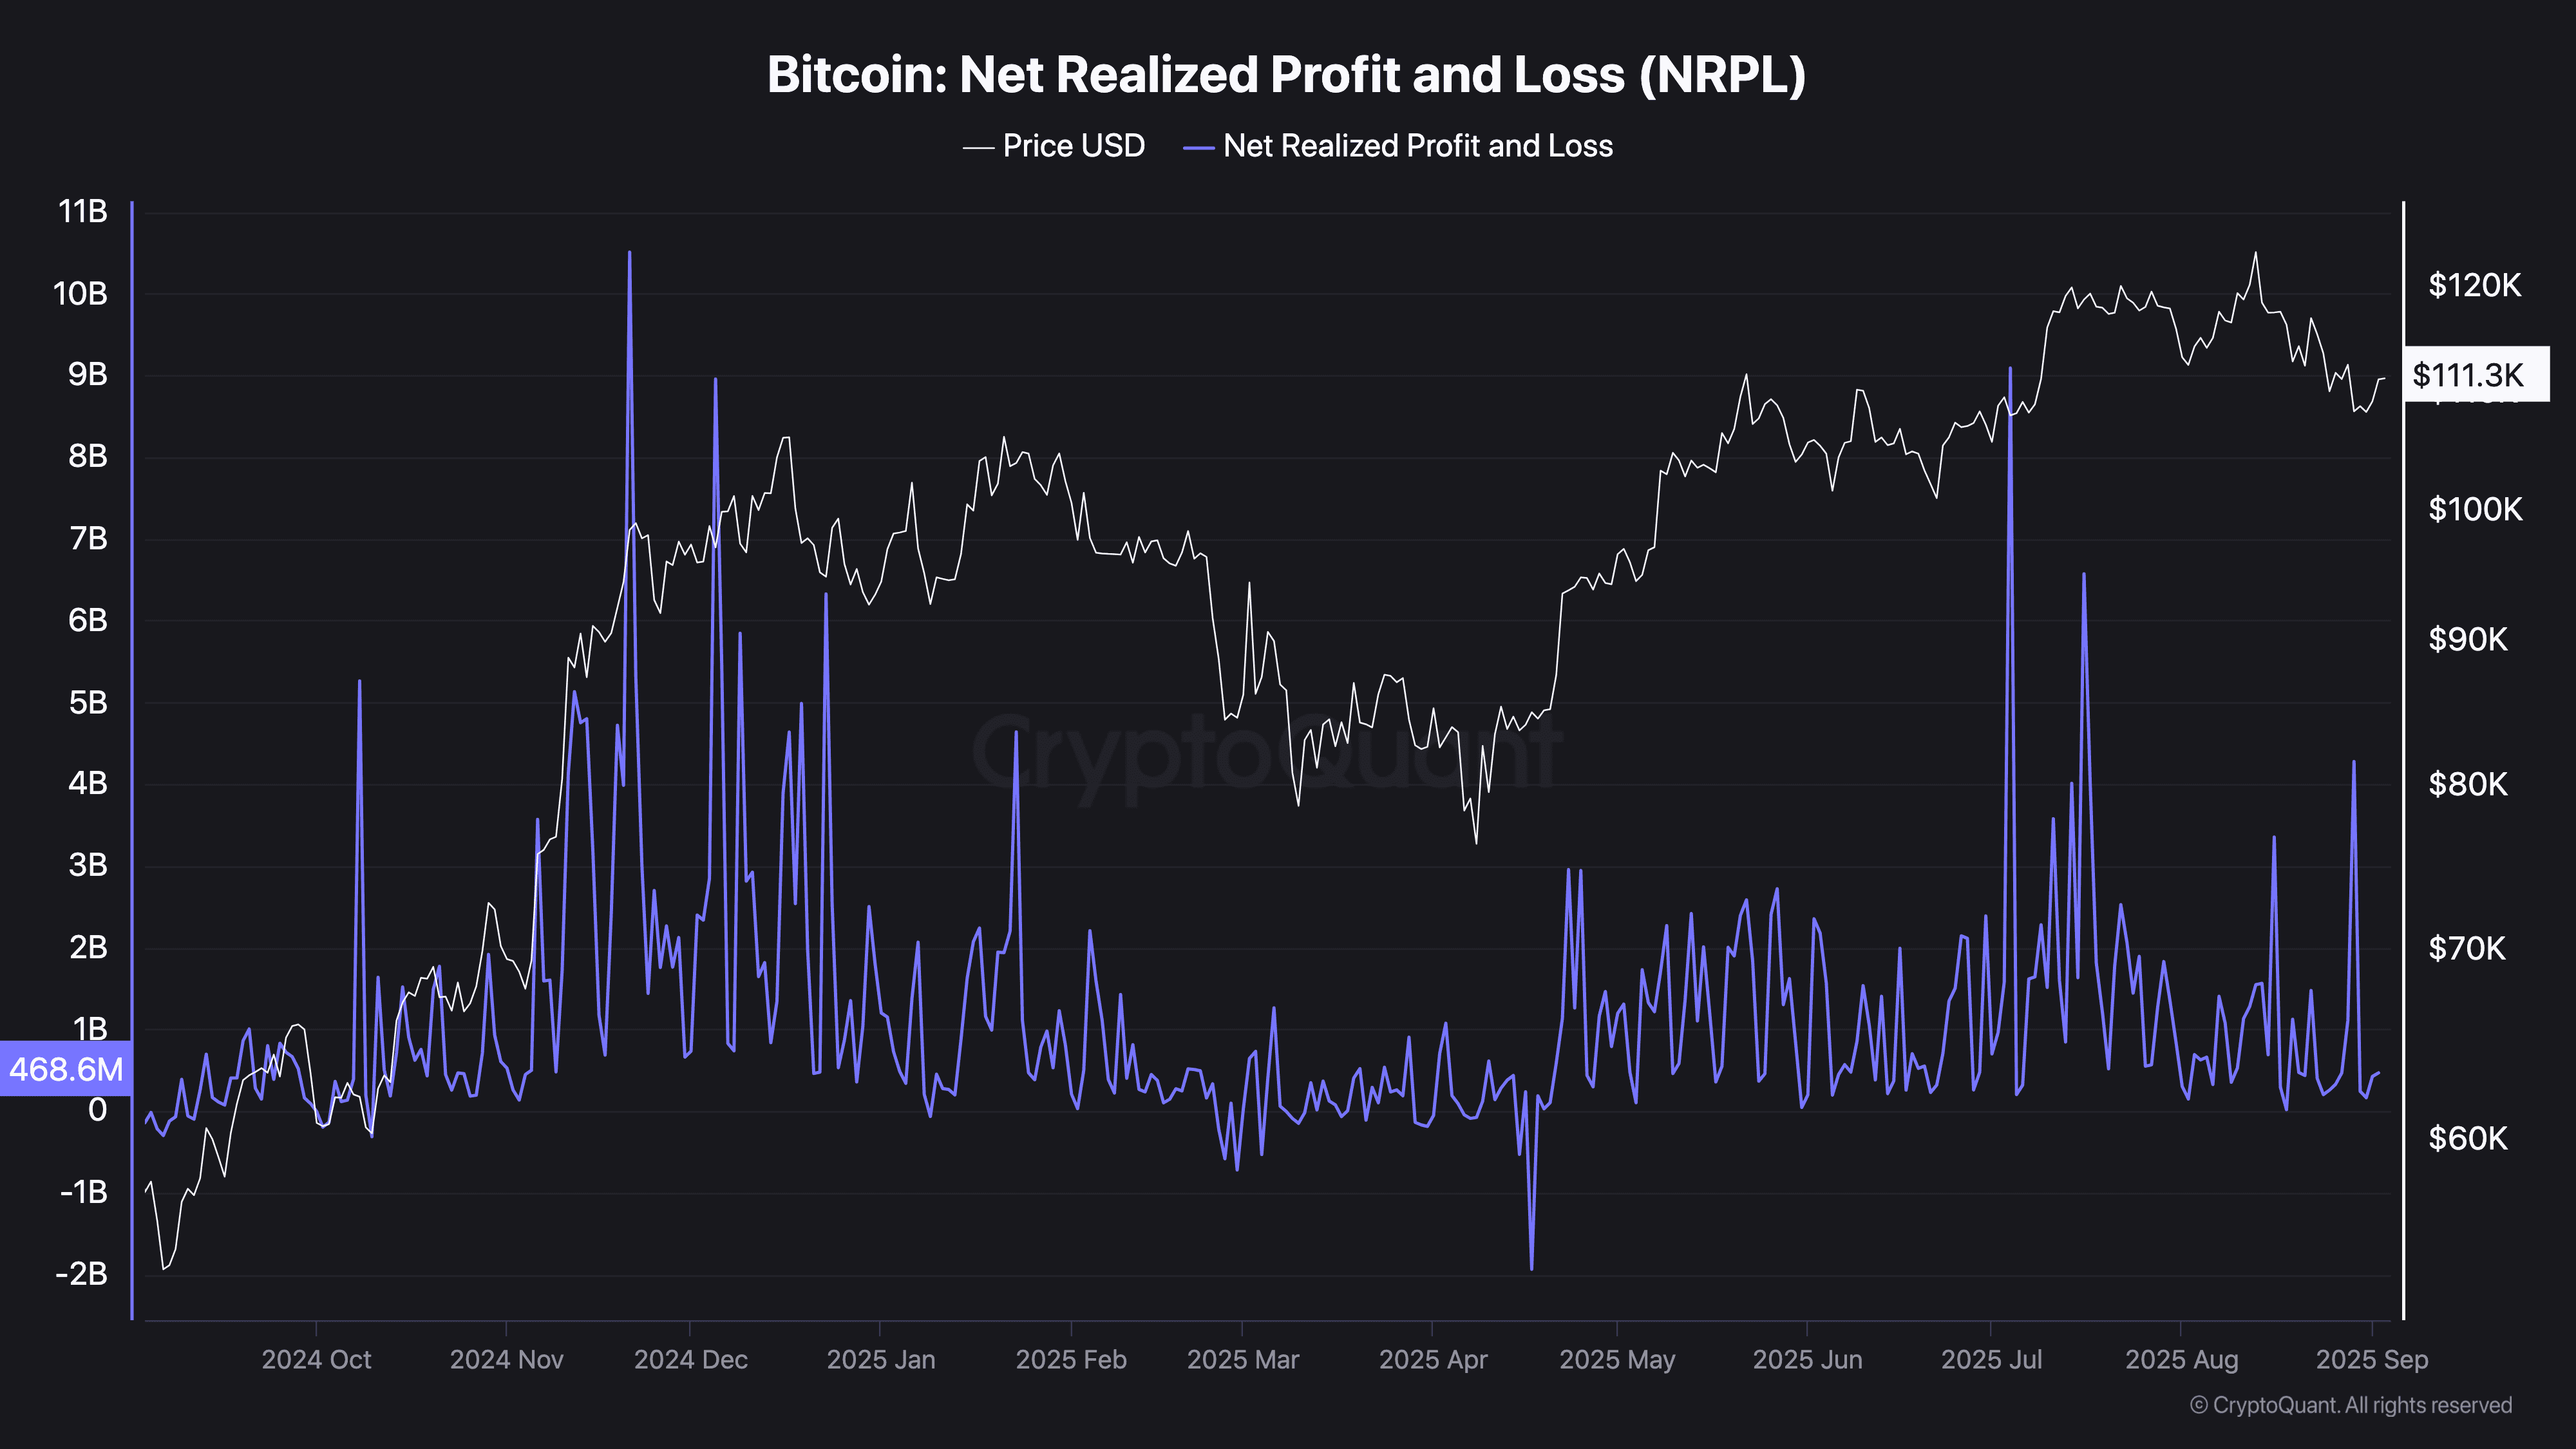
At the time of writing, Bitcoin was priced at around $111,200, with moderate gains over the past 24 hours and the past week. Most transactions still appear to be happening above cost, meaning selling is not coming from loss-driven exits. The tone in the market seems calm but cautious, with more participants choosing to take profits.
Average Whale Holdings Continue to Drop
The average Bitcoin balance held by large entities is now at its lowest level in nearly seven years. According to Glassnode, wallets holding between 100 and 10,000 BTC currently hold about 488 BTC on average. This is a level last seen in December 2018. The decline began in November 2024 and has continued into the present.
Consequently, this steady decrease shows that larger holders have been gradually reducing their positions. Whether this trend continues will depend on upcoming market conditions and external factors like macroeconomic policy and capital rotation.
Price Breaks Out of Downtrend
On the chart, Bitcoin has closed above a downward trendline that had held since early August. The move was pointed out by Rekt Capital, who noted,
“BTC has Daily Closed above its multi-week Downtrend.”
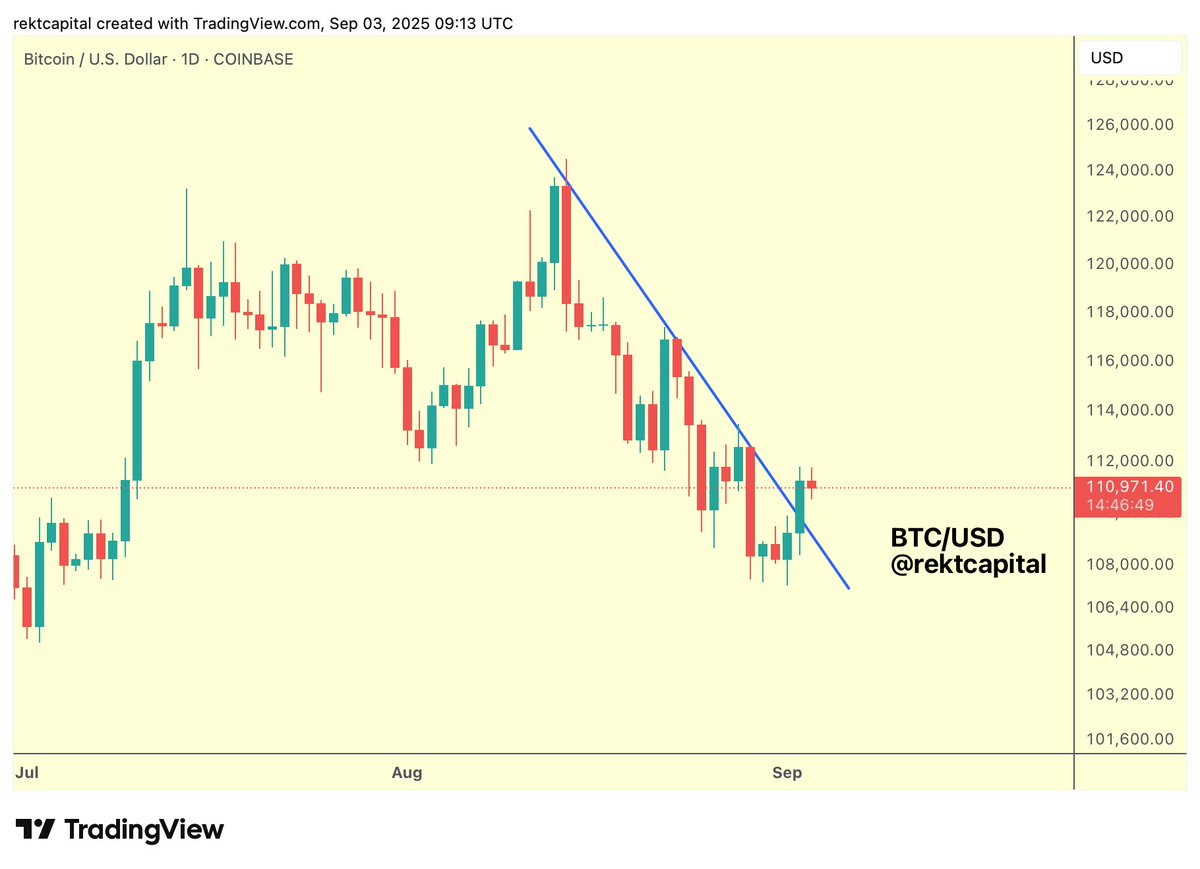
This breakout might indicate that the downtrend is weakening. Going further up from this point will rely on the ability of Bitcoin to hold above the trendline. Holding this level on a retest might strengthen short-term recovery possibilities. Failing that, buyer momentum could resume.
Binance Free $600 (CryptoPotato Exclusive): Use this link to register a new account and receive $600 exclusive welcome offer on Binance (full details).
LIMITED OFFER for CryptoPotato readers at Bybit: Use this link to register and open a $500 FREE position on any coin!