


Zcash (ZEC) plunges 32% in a week as RSI breaks down and key support levels fail. Analysts warn of further downside toward $300.
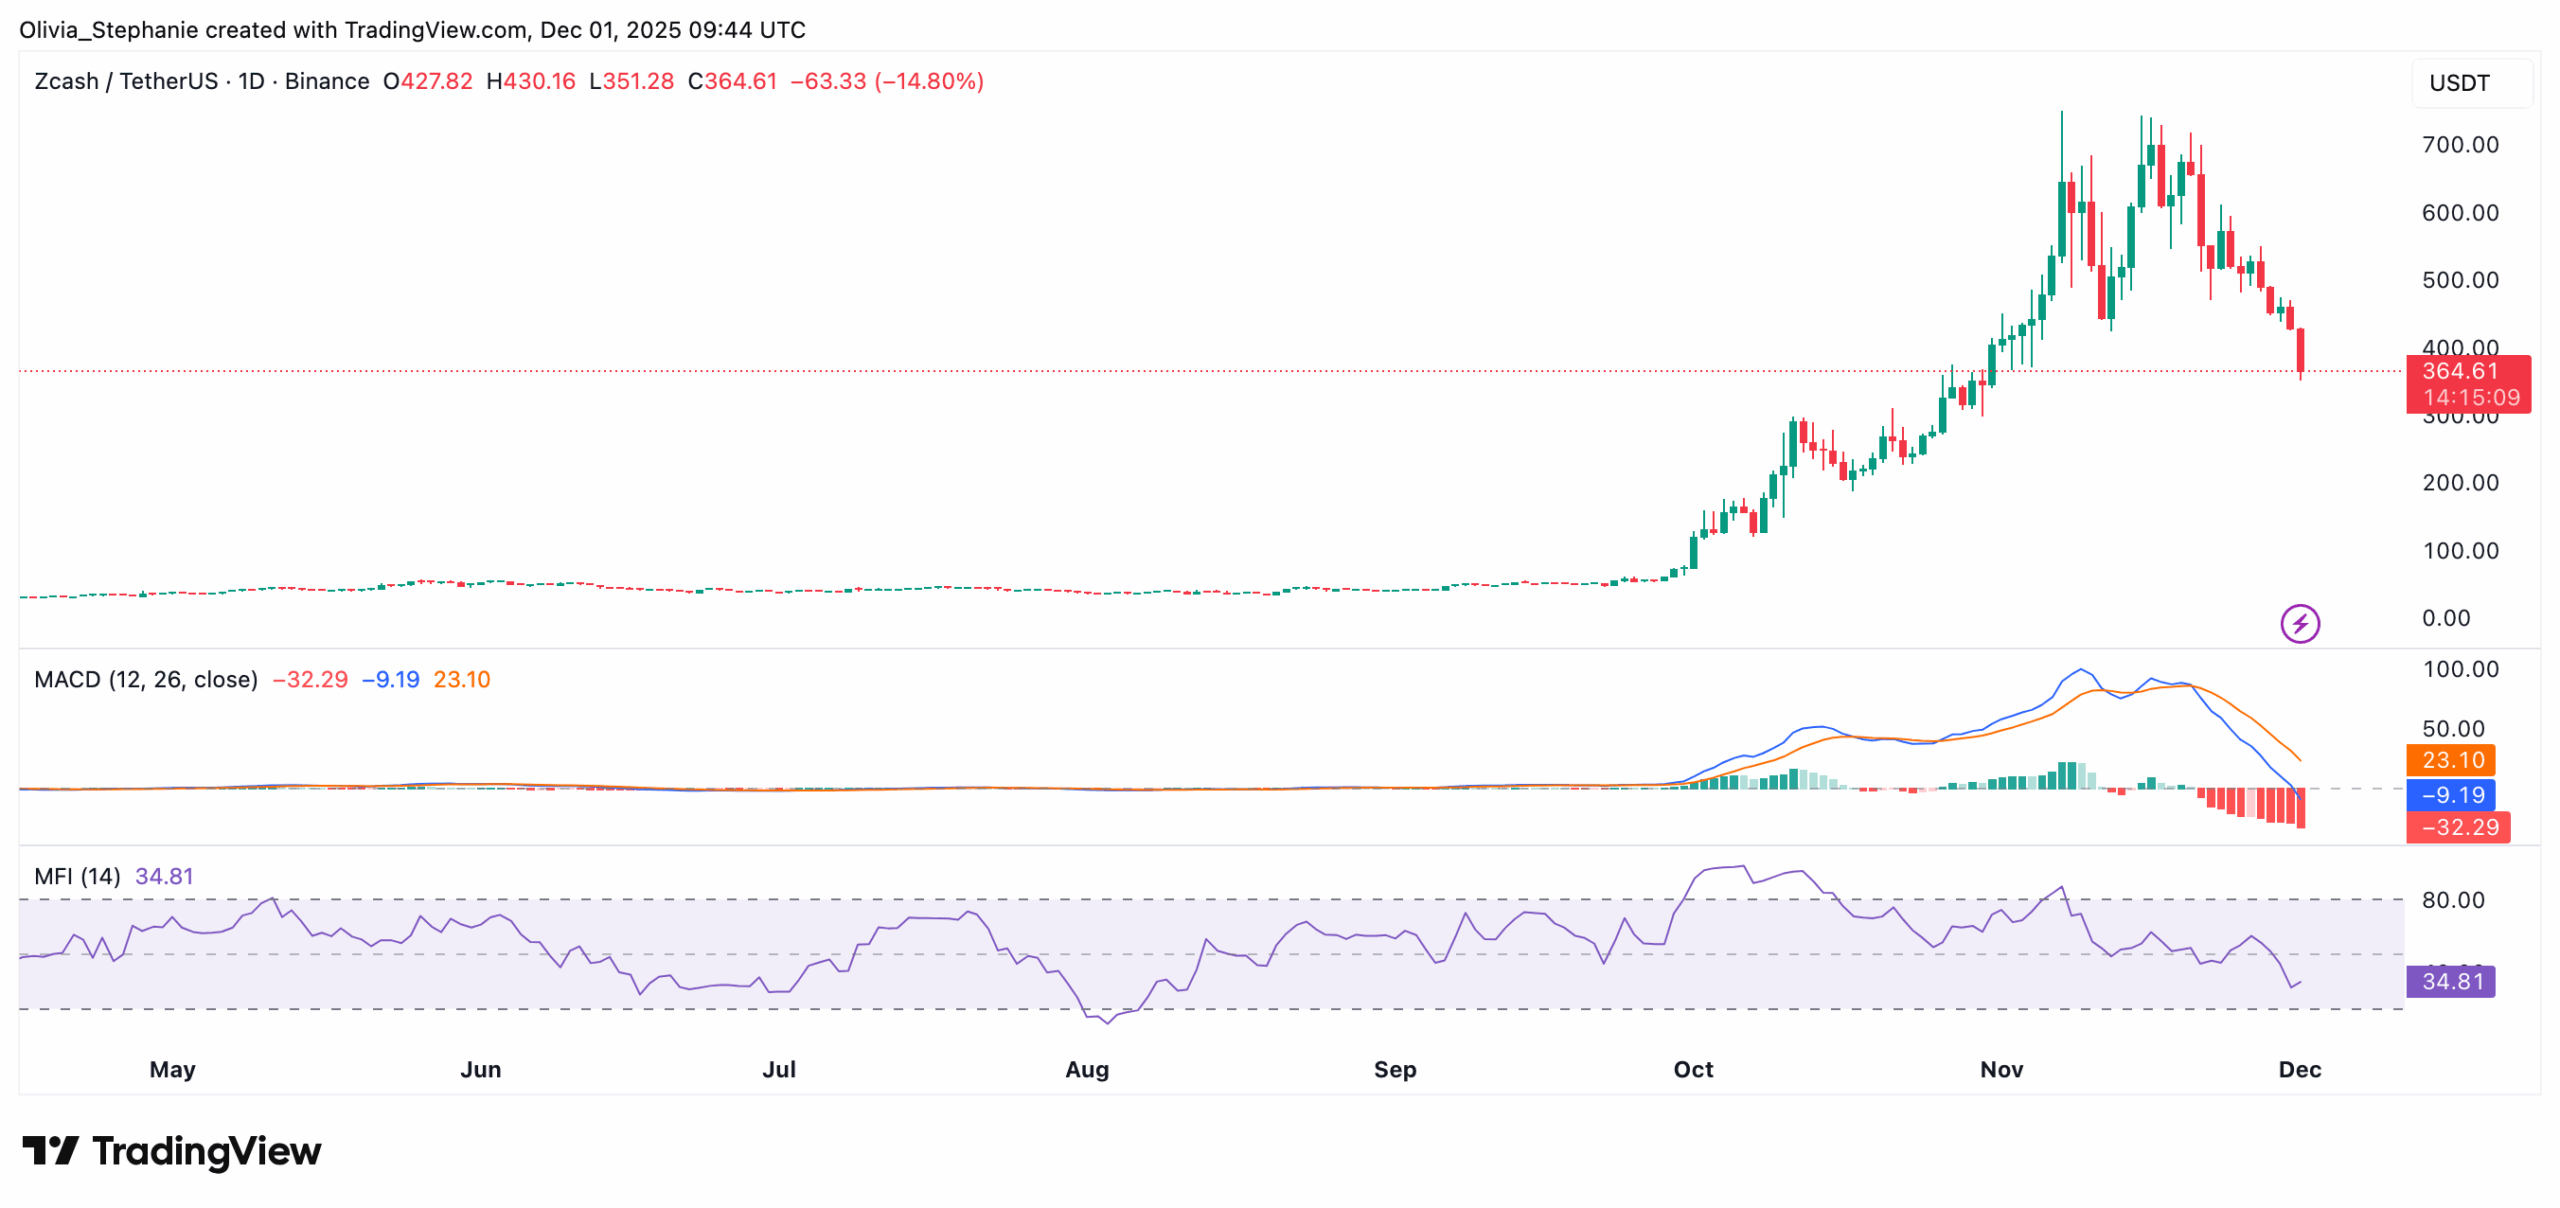
Zcash is under pressure after a steep price decline, falling more than 32% over the past week. The token is trading around $365 after dropping over 20% in the last 24 hours. The move follows the loss of key support levels, with traders watching whether the downtrend will continue.
ZEC had recently posted strong gains, rallying from $40 to $700 in just a few months. The current pullback, however, suggests that the trend may have shifted, with momentum now favoring the downside.
Key Technical Levels Breached
ZEC lost several important levels in a short period. The breakdown below the 50-day simple moving average, the $480 horizontal support, and the 38.2% Fibonacci retracement opened the door to further declines. As a result, the asset fell into the first major liquidity area around $400.
Crypto analyst Ardi had warned of growing weakness, pointing to a failed breakout in the RSI trend. “Repeated warnings of structure being broken” were noted after the loss of early support. He also cautioned that overexposed long positions were creating risk, adding, “5% moves were causing a cascade of liquidated long positions,” leading to even larger drawdowns.

Moreover, Zcash continued lower, reaching a second liquidity zone near $370. Ardi noted that he closed half his short position at this level. He added that if this zone breaks, the next area to watch is between $297 and $311, which includes the 61.8% Fibonacci level and a large pool of previous liquidity.
Trading volume has spiked, crossing $1 billion in the past 24 hours. ZEC has traded between $356 and $457 in the last day, with the broader 7-day range showing a high of $585 and a low near $358 (per CoinGecko data).
Momentum Indicators Show Further Weakness
Technical indicators support the current downtrend. The MACD continues to move lower, with the signal line confirming negative momentum. Red histogram bars are increasing in size, showing strong selling pressure.
You may also like:
Meanwhile, the Money Flow Index now stands at around 35, pointing to continued outflows, though nearing levels where past reversals have occurred.
Analyst Ali Martinez noted that ZEC had returned to a known support zone near $440.
“Bounce or breakdown?” he asked in a recent post.
That level has now broken, confirming lower lows and maintaining the bearish structure.
Uncertainty Over Long-Term Direction
Market opinion remains divided. Max Keiser commented,
“The $ZEC ‘pump ‘n dump’ is over. A trip back to $55 looks inevitable.”
His view reflects growing skepticism after the recent drop. Separately, it was recently reported that Grayscale has plans to convert its Zcash Trust into an exchange-traded fund (ETF). If approved, the ETF could make it easier for investors to gain exposure to ZEC without needing to hold the asset directly.
SECRET PARTNERSHIP BONUS for CryptoPotato readers: Use this link to register and unlock $1,500 in exclusive BingX Exchange rewards (limited time offer).