


Aster price is building a clean bullish reversal as the Stage 4 buyback begins ahead of schedule and traders return with stronger volume.
Summary
- Aster trades near $0.98 after a bounce from the $0.92 area.
- The team launched its Stage 4 buyback eight days early to support price amid market volatility.
- Technical indicators show improving momentum with RSI, Stochastic, and CCI turning upward.
Aster traded at $0.984 at press time, down 1.8% on the day, with a weekly range between $0.9007 and $1.18. The token sits about 15% lower over the past week and roughly 59% below its $2.41 all-time high from Sept. 24.
Trading volume rose sharply to $556M, an increase of 62%. CoinGlass data shows Aster (ASTER) derivatives volume up 31% to $1.27 billion while open interest rose 3.6%. This mix shows that more traders are adding exposure during a volatile stretch.
Aster Stage 4 buyback begins
On a Dec. 2 post on X, Aster announced that it had activated its Stage 4 buyback eight days earlier than planned. The team said the early rollout will “support holders during unstable market conditions,” and the program immediately went live on-chain.
The structure mirrors earlier stages. Protocol fees continue to drive the buybacks, and depending on volume, the burn allocation can reach half of all purchased tokens. Aster has already bought back 155.72 million ASTER across previous stages, including 55.72 million from Stage 3 alone, with 77.8 million scheduled for burning on Dec. 5.
Community members described the early start as a show of commitment, with one holder saying the move “proves the team is pushing real value, not empty promises.”
During peak volume periods the buyback engine has previously drawn more than $2 million per day, which helps reduce circulating supply while supporting liquidity incentives and future airdrop plans.
Aster price technical analysis
Aster’s chart shows a clear shift after a difficult end to November. A sharp drop pushed the token toward the $0.92–0.94 area, where buyers stepped in with heavier volume. Price then broke out of a short-term descending structure on Dec. 1 and has held a gentle upward path since.
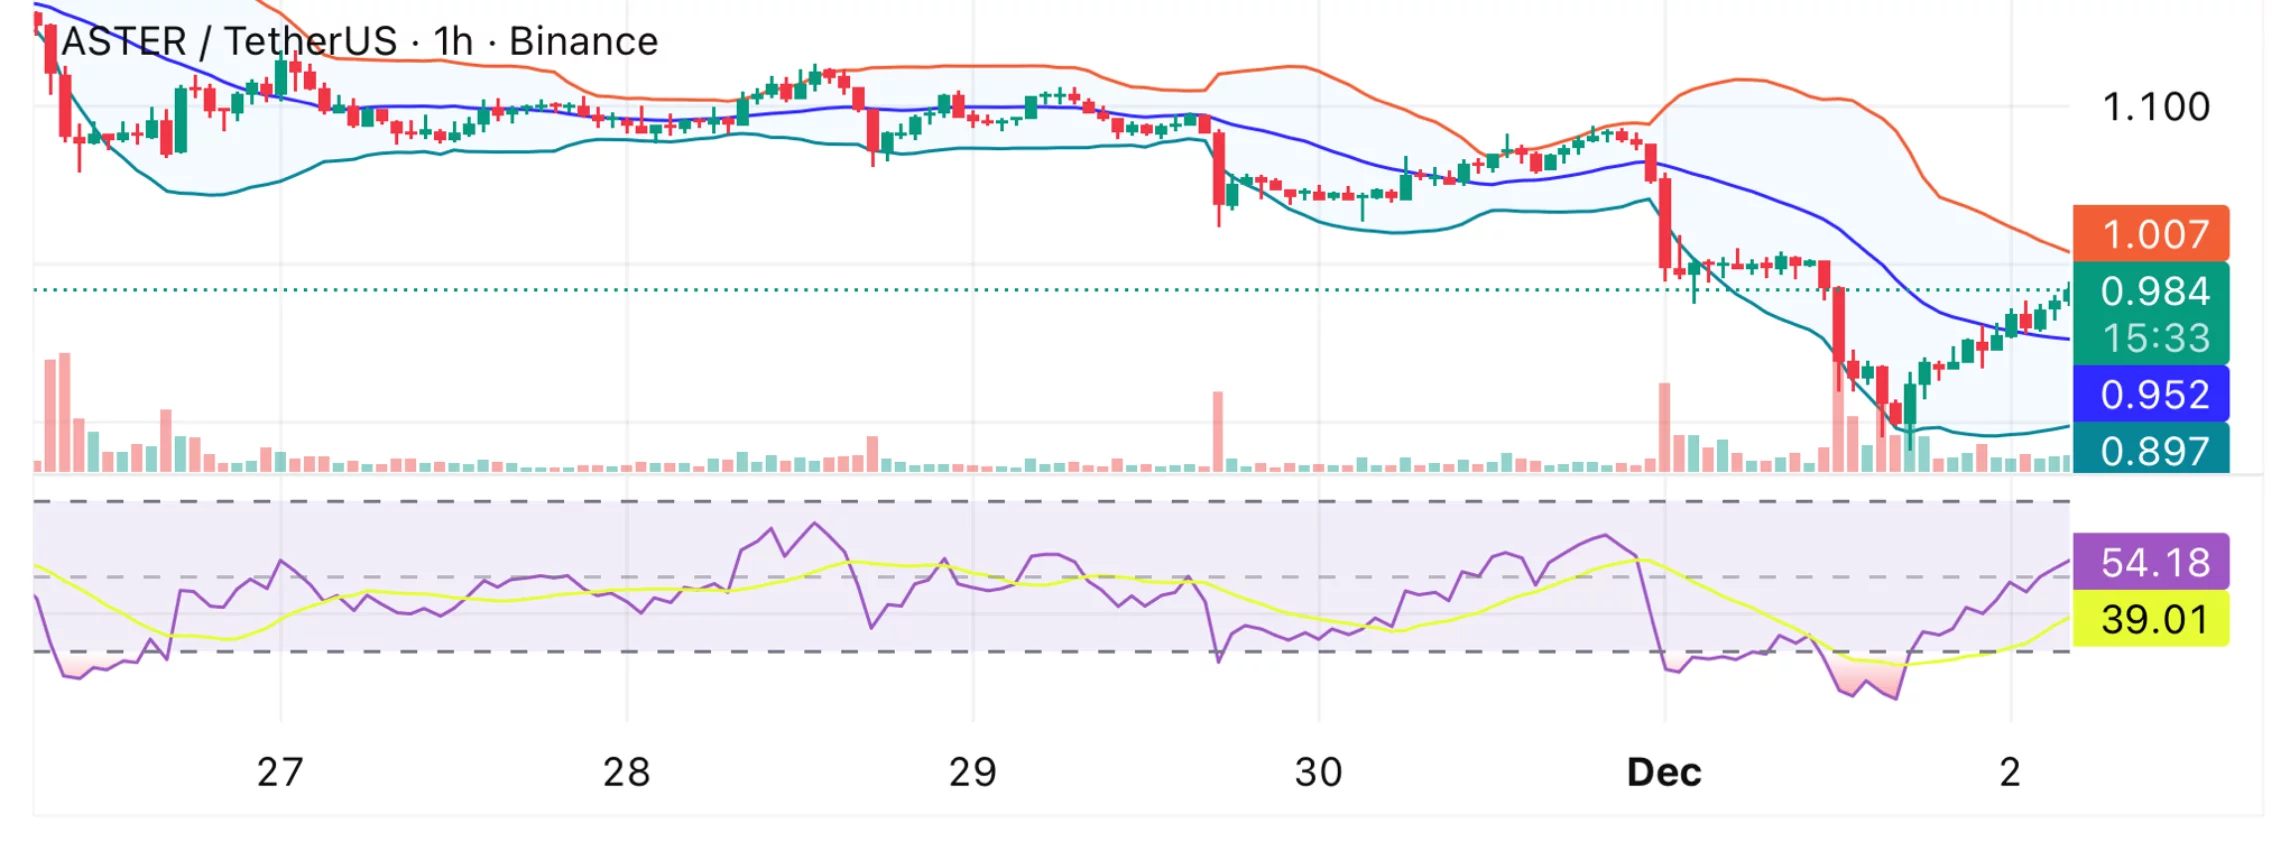
Early signs of recovery are shown by momentum indicators. The relative strength index has formed a clean bullish divergence. When the price formed a lower low, the RSI set a higher low, a pattern that often marks a bullish trend change.
Stochastic RSI and the commodity channel index also turned upward from oversold territory, showing stronger short-term momentum. Although the gap between its lines is narrowing, the MACD is still negative, and the ADX is close to 20, indicating that the trend is still developing rather than fully formed.
The majority of short-term moving averages, such as the 10MA and 20MA, are still higher than the current price despite these gains. That leaves $1.00 as the key test for bulls.
A strong daily close above this area would mark the first clean reclaim of local resistance and open room toward the $1.06–1.14 zone, where previous breakdown levels sit. A move through that range would complete the rebound pattern that began on Dec. 1.
Downside pressure may return if the price slips under $0.95, which could pull it back to $0.92 and possibly the $0.88–0.90 zone if market sentiment weakens.