

One number tells you whether United States institutions are buying Bitcoin or backing away: the gap between the price on Coinbase and the price on the rest of the world’s exchanges. Here is how the Coinbase Premium Index works, why it moved markets in 2026, and how to read it without fooling yourself.
Every market has a tell. In Bitcoin, one of the most watched is almost embarrassingly simple: the same coin trades on hundreds of venues at once, and the price is never exactly the same everywhere. Most of those gaps are noise. One of them is a signal, because of who trades where.
Coinbase is the exchange of record for regulated American money. Hedge funds, corporate treasuries, registered advisors, and, most importantly, the custodial and trading infrastructure behind the United States spot Bitcoin ETFs all route disproportionately through it. Binance and the other global venues carry everyone else. When Bitcoin trades richer on Coinbase than on the global market, someone in the American regulated system is paying up to buy. When it trades cheaper, that bid is gone, or has turned into supply.
The Coinbase Premium Index turns that gap into a single continuously updated number, and over the past two years it has become one of the most cited demand gauges in crypto, referenced by analysts to explain everything from the 2026 drawdown to the recoveries inside it. This guide covers what the index measures, how it is built, what it has actually predicted, where it breaks, and how to fold it into a sane analytical process.
How the index came to matter
The premium’s rise tracks the institutionalization of Bitcoin itself, and the history explains why the indicator means more now than when it was invented.
In the retail-dominated cycles of the 2010s, venue gaps were mostly about geography and capital controls: the Korea Premium’s spectacular blowouts told you where retail mania was, not what smart money thought. Coinbase was one venue among many, and no cohort was locked to it strongly enough for its price gap to mean anything specific.
The picture changed in stages. The 2020 to 2021 cycle brought the first corporate treasuries and funds whose compliance departments mandated regulated American venues, and analysts began noticing that sustained Coinbase strength preceded institutional announcements. Then January 2024 turned the correlation structural: the spot ETFs launched with Coinbase as the dominant custodian and a core trading venue in the creation and redemption plumbing, hard-wiring the largest new source of Bitcoin demand in history to a single price feed.
From that point, the premium stopped being a curiosity and became a cohort tracker. Every ETF creation ultimately touches the regulated dollar market the index watches; every institutional mandate that requires a regulated counterparty routes through the same pipes. The indicator did not get smarter. Its subject got bigger, more concentrated, and more decisive for price, which is the best thing that can happen to any gauge.
Reading the chart itself rewards knowing the two published flavors. The percentage index is the headline number and the right tool for comparisons across time and price levels. The premium gap, published alongside it, expresses the same difference in dollars, which makes short-term shifts easier to see but drifts with Bitcoin’s price level, since a fixed percentage is a bigger dollar gap at $100,000 than at $60,000. Analysts flip between them; beginners should default to the percentage version and treat multi-day averages, not raw ticks, as the unit of analysis.
What the Coinbase Premium Index measures
The index measures the percentage difference between Bitcoin’s price on Coinbase, quoted in United States dollars, and its price on a global reference exchange, most commonly Binance quoted in the USDT stablecoin. CryptoQuant popularized the formulation and publishes it continuously, and Coinglass and other data platforms maintain their own versions; some desks compute variants against other global venues, which is why quoted values differ slightly by source while the direction almost always agrees.
A positive reading means Bitcoin costs more on Coinbase than on the global market. A negative reading means it costs less. The magnitudes are tiny by design, usually hundredths of a percent, because arbitrage desks compress any persistent gap within minutes: if Coinbase trades meaningfully rich, a market maker buys on Binance, sells on Coinbase, and pockets the difference until the prices converge. What the arbitrage cannot erase is the direction of pressure. A venue where buyers keep lifting offers will sit persistently a few basis points rich no matter how fast the arbitrageurs work, the way water stays warmer near the heat source even as it circulates.
That persistence is the entire signal. A single positive print means nothing; a premium that holds positive for days or weeks means the American, regulated, dollar-funded side of the market keeps out-bidding the world, and there is only one class of participant with the size and the venue constraints to produce that pattern. This is why analysts read the index as a proxy for United States institutional demand: not because retail Americans do not use Coinbase, but because only institutional flows are large, persistent, and venue-locked enough to hold a price gap open against professional arbitrage.
Why Coinbase specifically
The index works because of a structural accident of regulation. American institutions face compliance requirements that offshore venues cannot satisfy: they need a regulated counterparty, dollar settlement, auditable custody, and a legal entity to sue. Coinbase built its business on being that counterparty, and the arrangement became self-reinforcing once the spot ETFs launched in 2024, since Coinbase serves as custodian for the large majority of them and its trading venues sit inside the creation and redemption plumbing that converts ETF share demand into actual Bitcoin purchases.
The result is a clean natural experiment running every trading day. The global price reflects worldwide demand: Asian retail, European funds, emerging-market flows, offshore leverage. The Coinbase price reflects all of that plus or minus one identifiable cohort. Subtracting one from the other isolates the cohort, at least approximately, which is more than almost any other public indicator in crypto can claim.
The USDT denominator adds a wrinkle worth knowing. The global leg is priced in a stablecoin, so the index technically includes any drift in USDT’s own dollar value. In calm times this is a rounding error; in a stablecoin stress event it can distort the reading, which is one of several reasons the index should be read in trends and confirmed against other data, never traded off a single print.
The 2026 track record
The index earned its current prominence through the most volatile year in Bitcoin’s institutional era, and the case file is worth walking because it shows both the power and the limits of the signal.
Through the December to February stretch, the premium sat persistently negative while Bitcoin fell from roughly $100,000 toward $60,000, correctly flagging that American institutional demand had left before the worst of the price damage arrived. The Fear and Greed Index spent a record stretch in extreme fear during the same quarter, and searches for Bitcoin going to zero hit all-time highs, but the premium offered a more specific piece of information than sentiment gauges: it said who was not buying.
The April episode showed the other direction. After roughly 40 days of negative readings, the premium flipped positive as United States demand stirred, then strung together a 14-day positive streak, the longest since Bitcoin’s October record above $126,000. Bitcoin rallied 14% that month to $78,000. The streak, not the flip, was the signal: analysts flagged the run of consecutive positive days as evidence of steady institutional accumulation, and the price followed while the streak held.
June supplied the stress test. As spot ETF outflows built toward their record month, the premium stayed negative throughout, confirming that the redemption wave was accompanied by an absent American spot bid, context that framed Bitcoin’s slide below $59,000. The negative premium then did something more interesting: it identified who was buying the dip by exclusion. When large wallets absorbed more than 270,000 BTC in two weeks while the premium stayed below zero, analysts could conclude the accumulation was not coming from United States spot desks, a detail that became central to the whale-versus-Wall-Street divergence story. An indicator that tells you who is not buying turns out to be as useful as one that tells you who is.
How to read the index in practice
The professional reading framework comes down to four habits.
Read streaks, not prints. The index oscillates around zero constantly, and single-day readings are dominated by microstructure noise. The informative patterns are runs: five, ten, fourteen consecutive days on one side of zero. The 2026 record shows the market rewarding streak-reading and punishing print-reading all year.
Read direction of change alongside level. A premium recovering from deeply negative toward zero, as it did through February and March, signals selling pressure exhausting even before the sign flips. A positive premium that is shrinking day by day during a rally is an early warning that the institutional bid is fading into strength, historically a distribution pattern.
Read it against price. The highest-information setups are disagreements. Price falling while the premium holds positive means American institutions are absorbing the decline, a constructive divergence. Price rising while the premium sits negative means the rally is running on offshore leverage or non-United States demand, the fragile kind that unwinds fast. Agreement between price and premium mostly confirms what you already knew.Read it inside a dashboard, never alone. The premium is one demand gauge for one cohort. The serious version of flow analysis pairs it with ETF creations and redemptions, funding rates for the leverage picture, and on-chain accumulation cohorts, each covered in our companion explainer on how ETF flows actually work. When premium, flows, and on-chain data agree, conviction is warranted. When they split, the split itself is the story, as June proved.
A worked example: reading one week of data
Abstract rules land better with a concrete walk-through, so take a stylized week resembling late June 2026 and read it the way a desk would.
Monday: Bitcoin drops 3%, the premium prints -0.02%, ETF flows show a $300 million outflow. All three gauges agree: American institutional supply is driving the tape. Nothing to do but note the regime.
Tuesday and Wednesday: price stabilizes near the lows, the premium stays negative but shrinks toward -0.005%, outflows continue. The shrinking discount into flat price is the first tell: the selling pressure on the regulated venue is exhausting even though the headlines still read record outflows. This is the direction-of-change habit doing its work.
Thursday: price bounces 4% on a macro headline, the premium ticks barely positive for one session, one ETF prints an inflow while the largest fund still bleeds. The beginner reads a reversal; the framework reads an unconfirmed bounce, because one print is not a streak and one fund is not breadth.
Friday: price holds the bounce, the premium slips back to slightly negative, on-chain data shows large-wallet accumulation continuing. Now the full picture resolves: the recovery is real but not American-institution-led; offshore and over-the-counter demand is carrying it, and the regulated cohort has stopped selling without starting to buy. That is a specific, tradeable description of the market that no single gauge produced, and the premium’s contribution was telling you whose bid was and was not present each day.
The exercise generalizes. The index is not a buy or sell light; it is one witness in a lineup, and its testimony is about identity: which cohort’s money moved today. Cross-examined against flows and on-chain data, it turns anonymous price action into a story with named actors, which is as close to an information edge as free public data gets.
Where the indicator breaks
Every popular indicator degrades, and the premium’s failure modes are well documented.
The proxy is approximate. Coinbase hosts plenty of American retail alongside the institutions, and institutional flows increasingly route through over-the-counter desks that never touch the public order book at all, invisible to the index by construction. The whale accumulation of June happened almost entirely off-exchange, which is exactly why the premium missed it. The index sees the regulated public bid, nothing more.
Mechanical distortions produce false signals. Large arbitrage flows around ETF creation windows, USDT price drift, exchange outages, and even fee changes can push the number around without any change in real demand. The Korea Premium, an older sibling indicator, spent years generating famous distortions for structural reasons, and every venue-gap indicator carries a version of that risk.
The signal decays with fame. As more traders condition on the premium, the reflexive trades around it front-run the pattern the indicator was built to detect. The 14-day streak in April was tradeable partly because it was still early in the indicator’s mainstream fame; each subsequent cycle prices it faster.
And regime changes can rewire the plumbing entirely. The premise linking Coinbase to American institutional flow depends on custody concentration and market structure rules as they exist now. New custodians, in-kind ETF mechanics maturing, or a major venue shift would all change what the gap measures without anyone updating the dashboards. Indicators measure plumbing, and plumbing gets renovated.
None of this makes the index useless; it makes it an instrument with a stated range. Inside that range, one number updated in real time that approximately isolates the most influential buyer cohort in the market is still one of the best free tools in crypto.
The bigger family of premium indicators
The Coinbase Premium is the most famous member of a whole family of venue-gap gauges, and knowing the relatives sharpens the reading.
The Korea Premium, often called the kimchi premium, measures Korean exchange prices against global ones and famously blew out above 20% during retail manias, reflecting capital controls that block the arbitrage which keeps the Coinbase gap tiny. Futures basis, the gap between futures and spot prices, plays the same role for leverage demand. Stablecoin premiums in specific countries track local dollar hunger. Each gauge isolates a cohort by exploiting some friction, regulatory, geographic, or structural, that stops arbitrage from erasing the information.
Read together, the family sketches a live map of who wants Bitcoin where. In June 2026 that map showed America selling through regulated wrappers, offshore whales absorbing over the counter, and the premium family caught the whole handoff in real time. No single number told the story. The disagreement between them did.
Five mistakes beginners make with the premium
The indicator’s simplicity invites misuse, and the recurring errors are predictable enough to list.
Trading the flip. The most common mistake is treating the zero line as a trigger, buying the first positive print after a negative stretch. The index crosses zero constantly on noise; the April signal was fourteen consecutive positive days, not the first one. If a rule must exist, streak length and multi-day averages are the raw material, never a single crossing.
Ignoring magnitude context. A -0.001% reading after a -0.03% stretch is improvement; the same number after weeks of positive readings is deterioration. Beginners read the sign; the information is usually in the trajectory, which is why analysts describe the premium in terms like recovering, fading, or pinned rather than positive or negative.
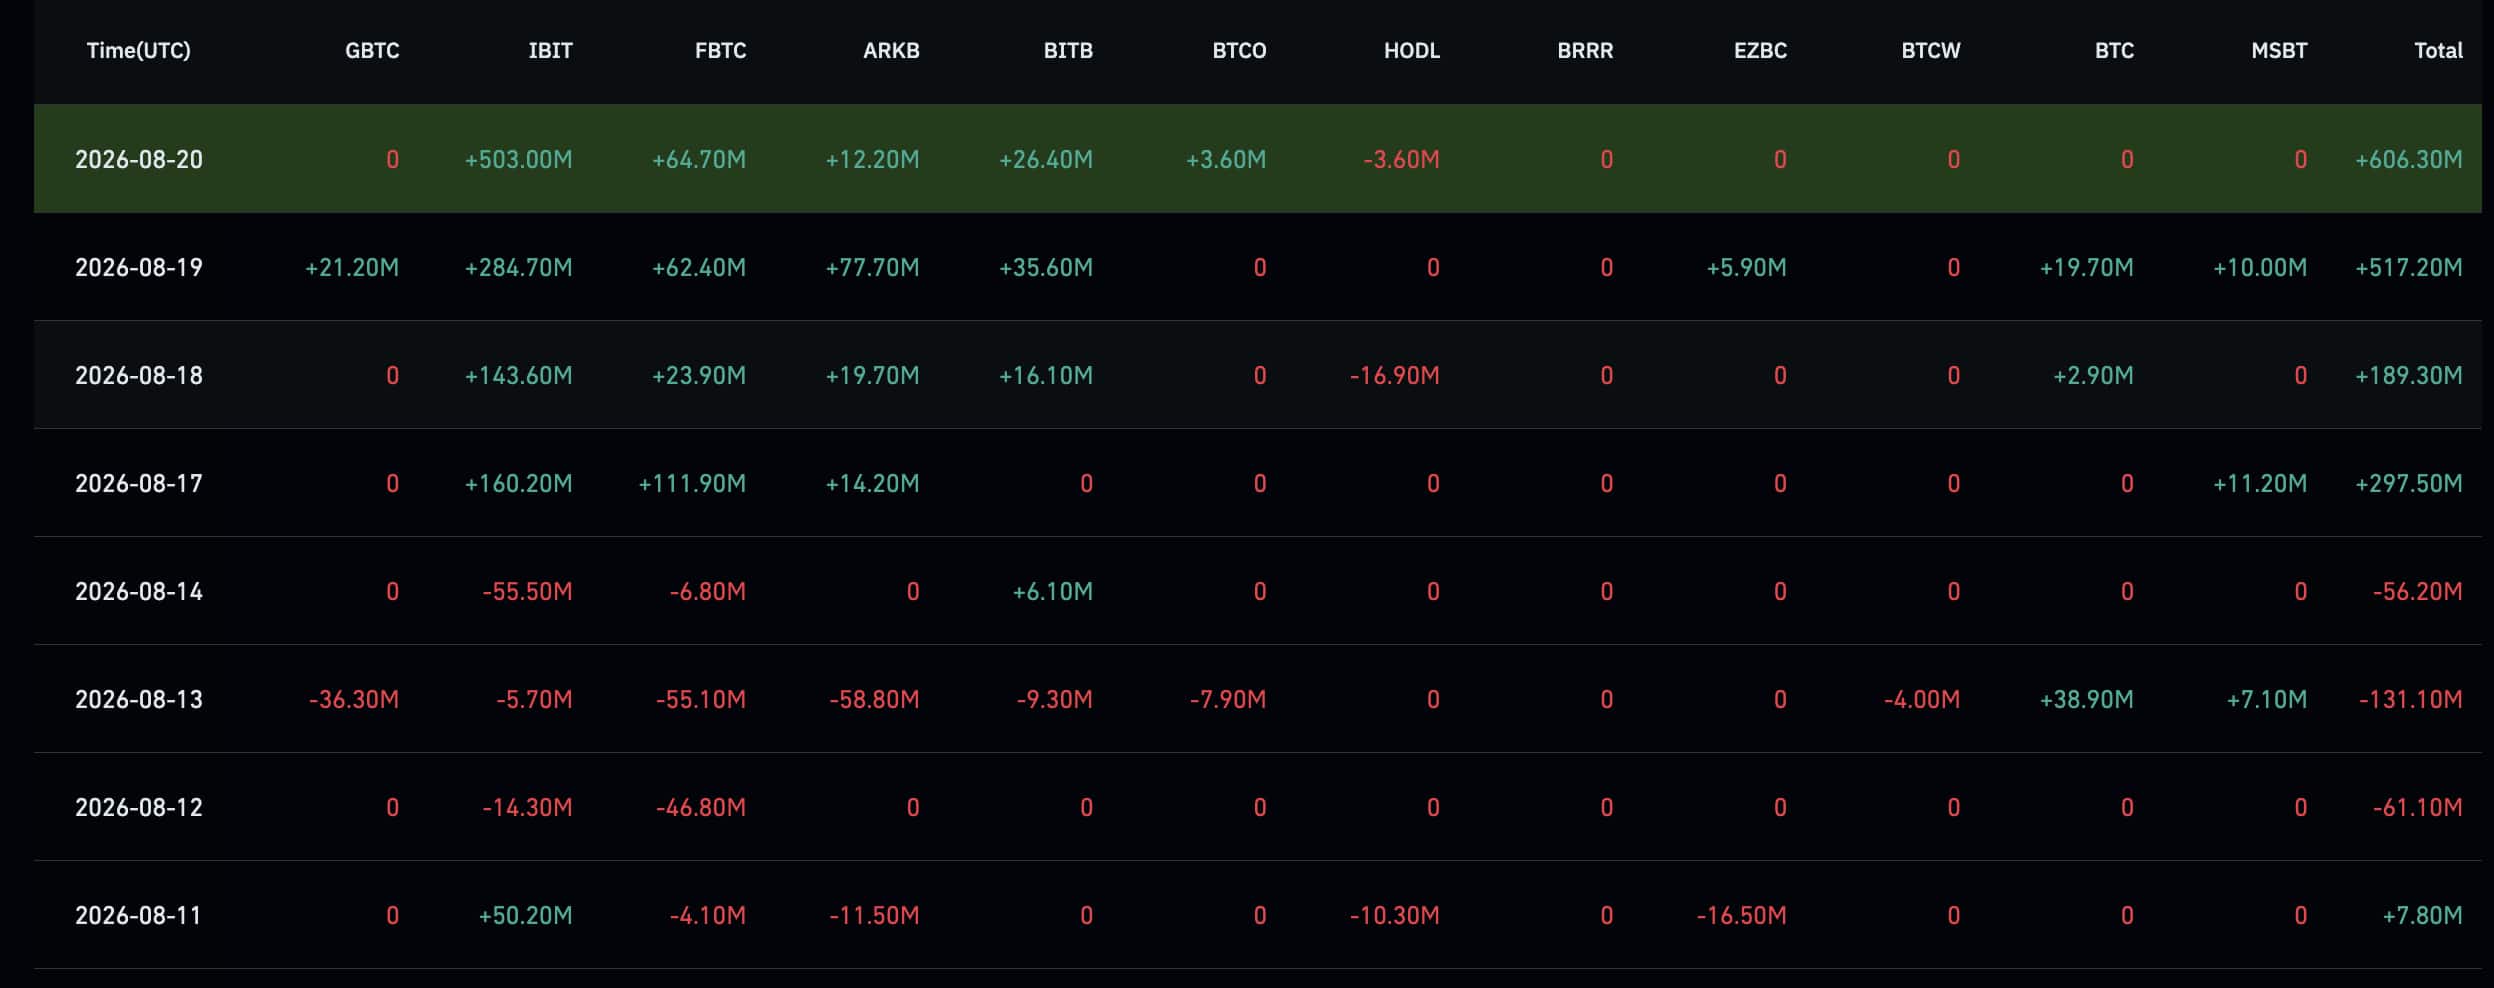
Assuming the premium is the ETFs. The two datasets rhyme but are not the same: ETF flows measure fund expansion once a day with a lag, while the premium tracks live order-book pressure that includes non-ETF institutional and retail activity. They diverge routinely, and the divergence carries information, as when a negative premium accompanies flat flows, suggesting non-ETF American selling.
Forgetting the OTC blind spot. The largest transactions in the market negotiate privately and settle without touching any public order book. A quiet premium during heavy on-chain accumulation does not contradict the accumulation; it locates it off-exchange. June 2026 was the canonical case, and readers who treated the flat premium as evidence against the whale buying misread both datasets at once.
Anchoring to old regimes. The premium’s meaning is downstream of market structure, and structure changes. Pre-2024 charts describe a different indicator in everything but name, and comparisons across the ETF boundary mislead more than they inform. The honest habit is to treat roughly two years of history as the relevant sample and to re-derive the baseline whenever the plumbing changes, as it did with in-kind settlement.
Avoiding these five errors puts a reader ahead of most of the commentary that cites the index, which is a low bar the indicator deserves better than.
Frequently asked questions
What is the Coinbase Premium Index in simple terms?
It is the percentage difference between Bitcoin’s price on Coinbase and its price on a global exchange, usually Binance. A positive number means American buyers on the regulated venue are paying more than the rest of the world, which analysts read as United States institutional demand. A negative number means that demand is weak or has turned into selling.
Who calculates the Coinbase Premium Index?
CryptoQuant publishes the most widely cited version, comparing the Coinbase Bitcoin price in dollars against the Binance price in USDT. Coinglass and other analytics platforms publish their own variants, sometimes against different reference exchanges, so exact values differ slightly across sources while the direction and trend almost always match.
Why does a positive premium suggest institutional buying?
Because of who is structurally locked into Coinbase. Regulated American funds, corporate treasuries, and the infrastructure behind spot Bitcoin ETFs route through regulated dollar venues for compliance and custody reasons. Only flows that are large, persistent, and venue-constrained can hold a price gap open against arbitrage, and that description fits institutions, not retail.
How big is a typical premium reading?
Very small, usually within a few hundredths of a percent of zero, because arbitrage desks close larger gaps within minutes. The information is not in the size but in the sign and its persistence: many consecutive days of positive or negative readings signal sustained demand or its absence.
Can the Coinbase Premium predict Bitcoin’s price?
Not by itself. Sustained positive streaks have historically accompanied or preceded rallies, including the 14-day streak before Bitcoin reached $78,000 in April 2026, and persistent negative readings accompanied the 2026 drawdown. But the index measures one cohort’s demand, misses over-the-counter flows entirely, and works best as confirmation alongside ETF flows, funding rates, and on-chain data.
What does a negative premium during whale accumulation mean?
It means the buying is not coming from United States spot desks. In June 2026, whales absorbed more than 270,000 BTC while the premium stayed negative, telling analysts the accumulation ran through offshore and over-the-counter channels rather than the American regulated market. The index identifies buyers by exclusion as well as by presence.
How is the Coinbase Premium different from the kimchi premium?
Both compare one region’s price to the global market, but the Korea Premium can reach extreme levels, historically above 20%, because Korean capital controls block the arbitrage that keeps the Coinbase gap within basis points. The Coinbase version is a demand thermometer; the Korean version is closer to a capital-controls gauge.
Where can I track the Coinbase Premium Index?
CryptoQuant and Coinglass both publish live charts, and several free dashboards mirror the data. Most platforms show the index alongside related gauges like ETF net flows and funding rates, which is the right way to consume it, since the premium is designed to be read in context rather than in isolation.
Disclaimer: This article is for informational purposes only and does not constitute investment advice. Digital asset markets are volatile and you can lose your entire investment. Always do your own research. Information current as of July 4, 2026.