Key Takeaways
- Bitcoin’s price trades near $83,770, with resistance between $83,900 and $84,200 limiting its latest recovery.
- Bitcoin’s RSI sits at 52, while negative momentum signals suggest the rebound still lacks confirmation.
- Bitcoin remains above its longer-term averages, but losing $82,500 could expose the $80,308 low.
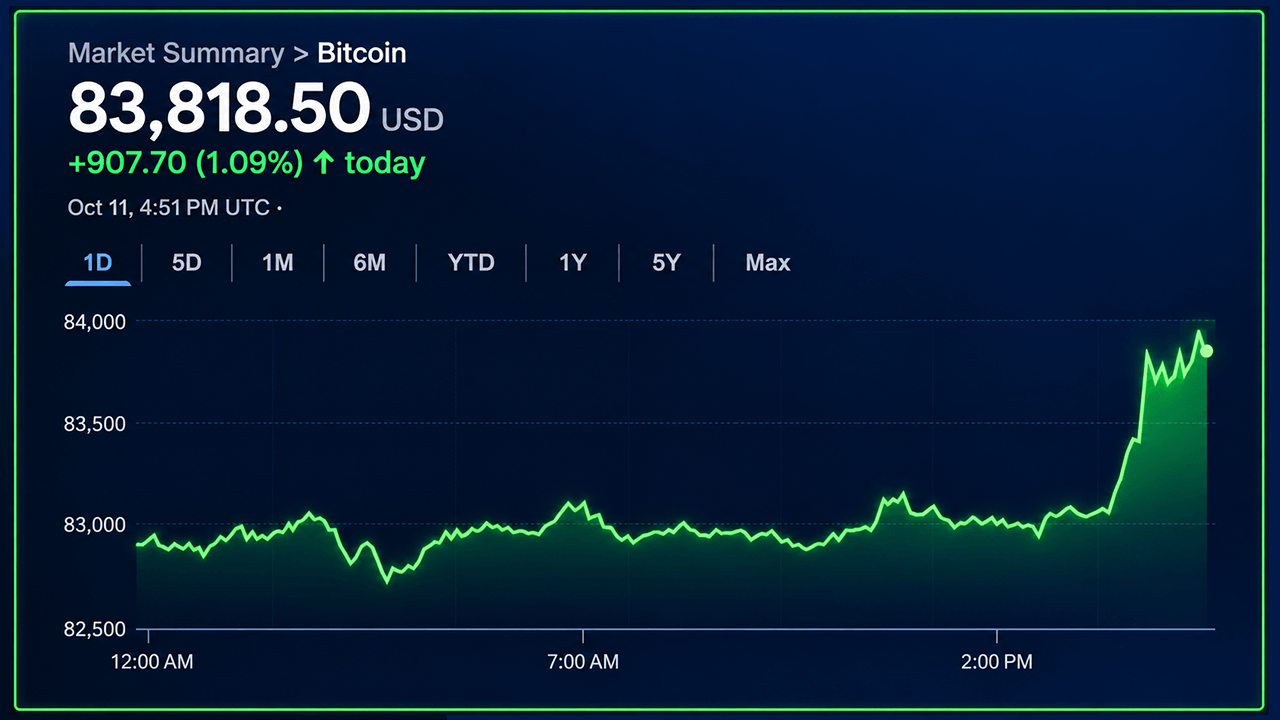
Bitcoin’s price is knocking on the door of $84,000, but the technical picture suggests the bulls haven’t quite found the key. Trading at $83,771.70, the leading cryptocurrency has advanced 0.9% over the past 24 hours, with its $1.683 trillion market capitalization reflecting a market that has recovered some ground without establishing a convincing breakout.
The latest readings reveal an interesting contradiction, as bitcoin trades above several important short-term exponential averages while remaining beneath comparable simple averages, creating a technical tug-of-war that could determine whether the recovery gathers momentum or runs out of steam.
Bitcoin’s Hourly Chart Tests the $84,000 Ceiling
The one-hour chart shows bitcoin consolidating between $83,700 and $83,800 after breaking away from an earlier trading range near $83,000. The advance followed a recovery from $80,308, with increased trading activity accompanying the initial move higher.
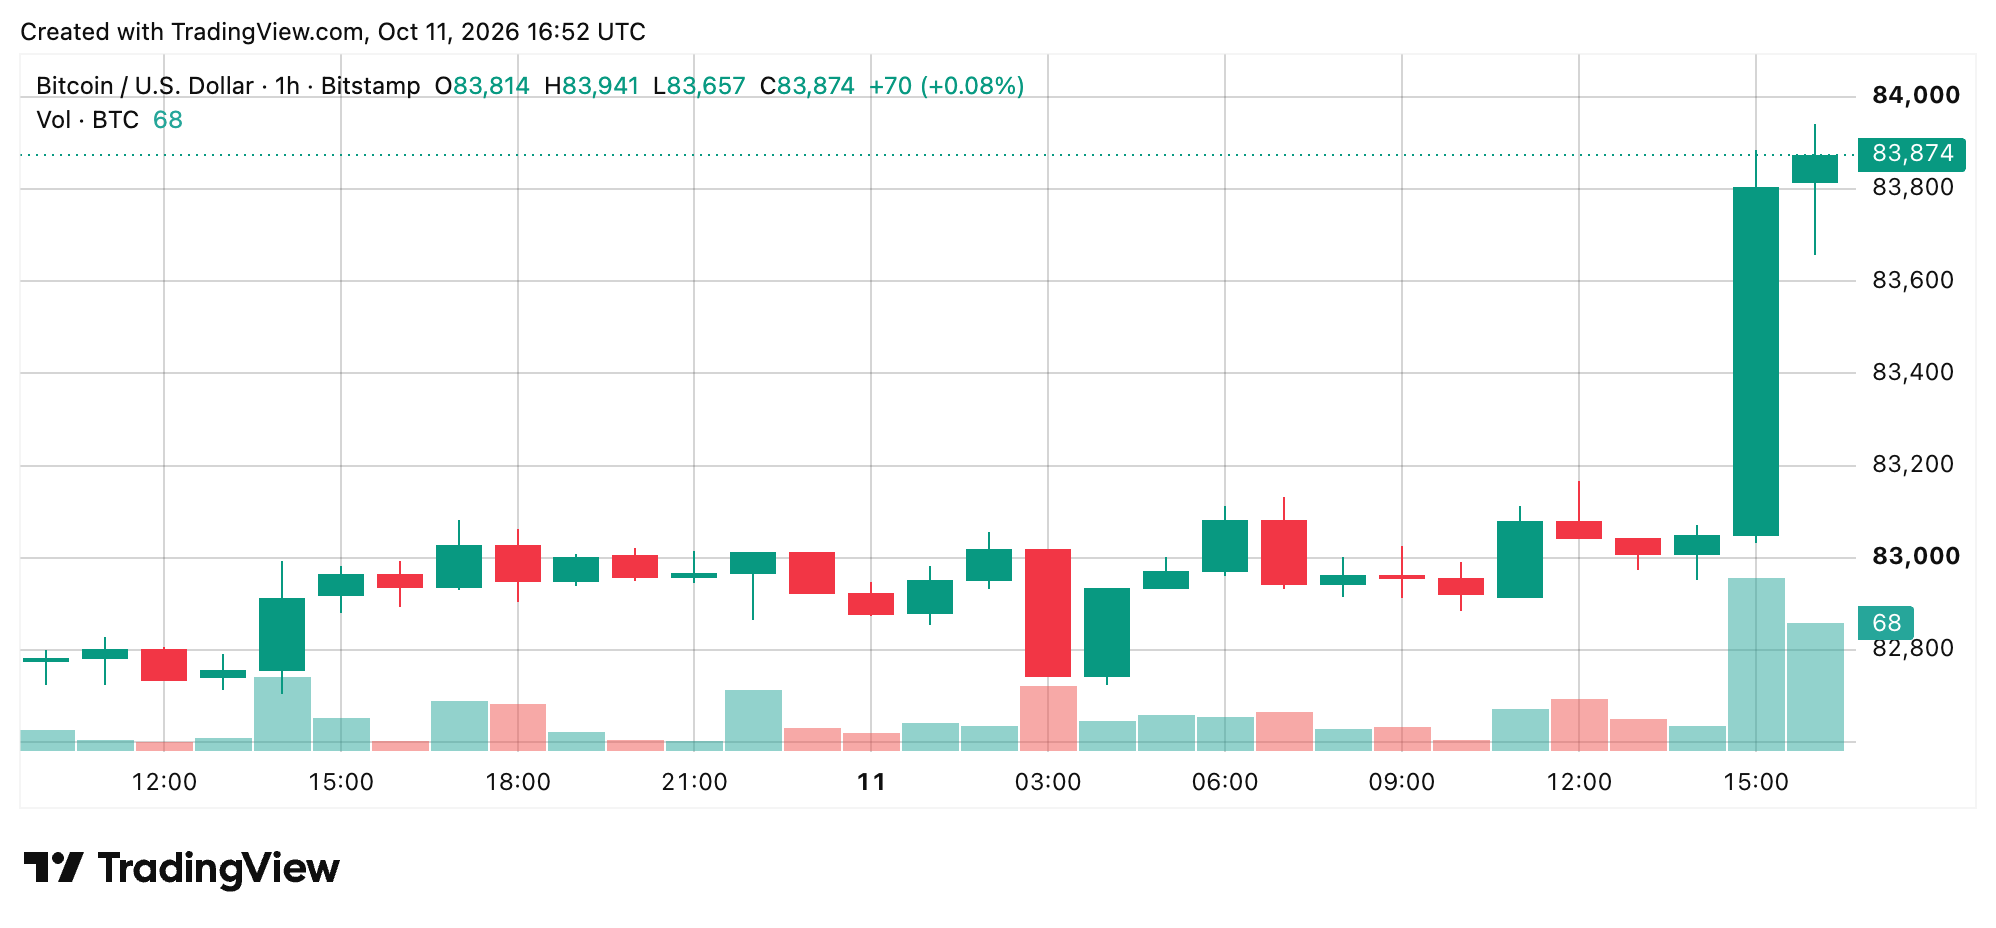
However, resistance between $83,900 and $84,200 remains a stubborn obstacle, and the latest price action has yet to establish a sustained foothold above that territory. A decisive move beyond $84,000 would bring $84,800 into focus, while another rejection could send bitcoin back toward $83,300 and eventually $83,000.
Four-Hour Chart Reveals Improving Structure
The four-hour chart offers a somewhat more encouraging interpretation, with a developing sequence of higher lows suggesting that bearish pressure has gradually eased since bitcoin retreated from $86,677. Nevertheless, the recovery remains incomplete, particularly as price continues to encounter resistance around $84,000.
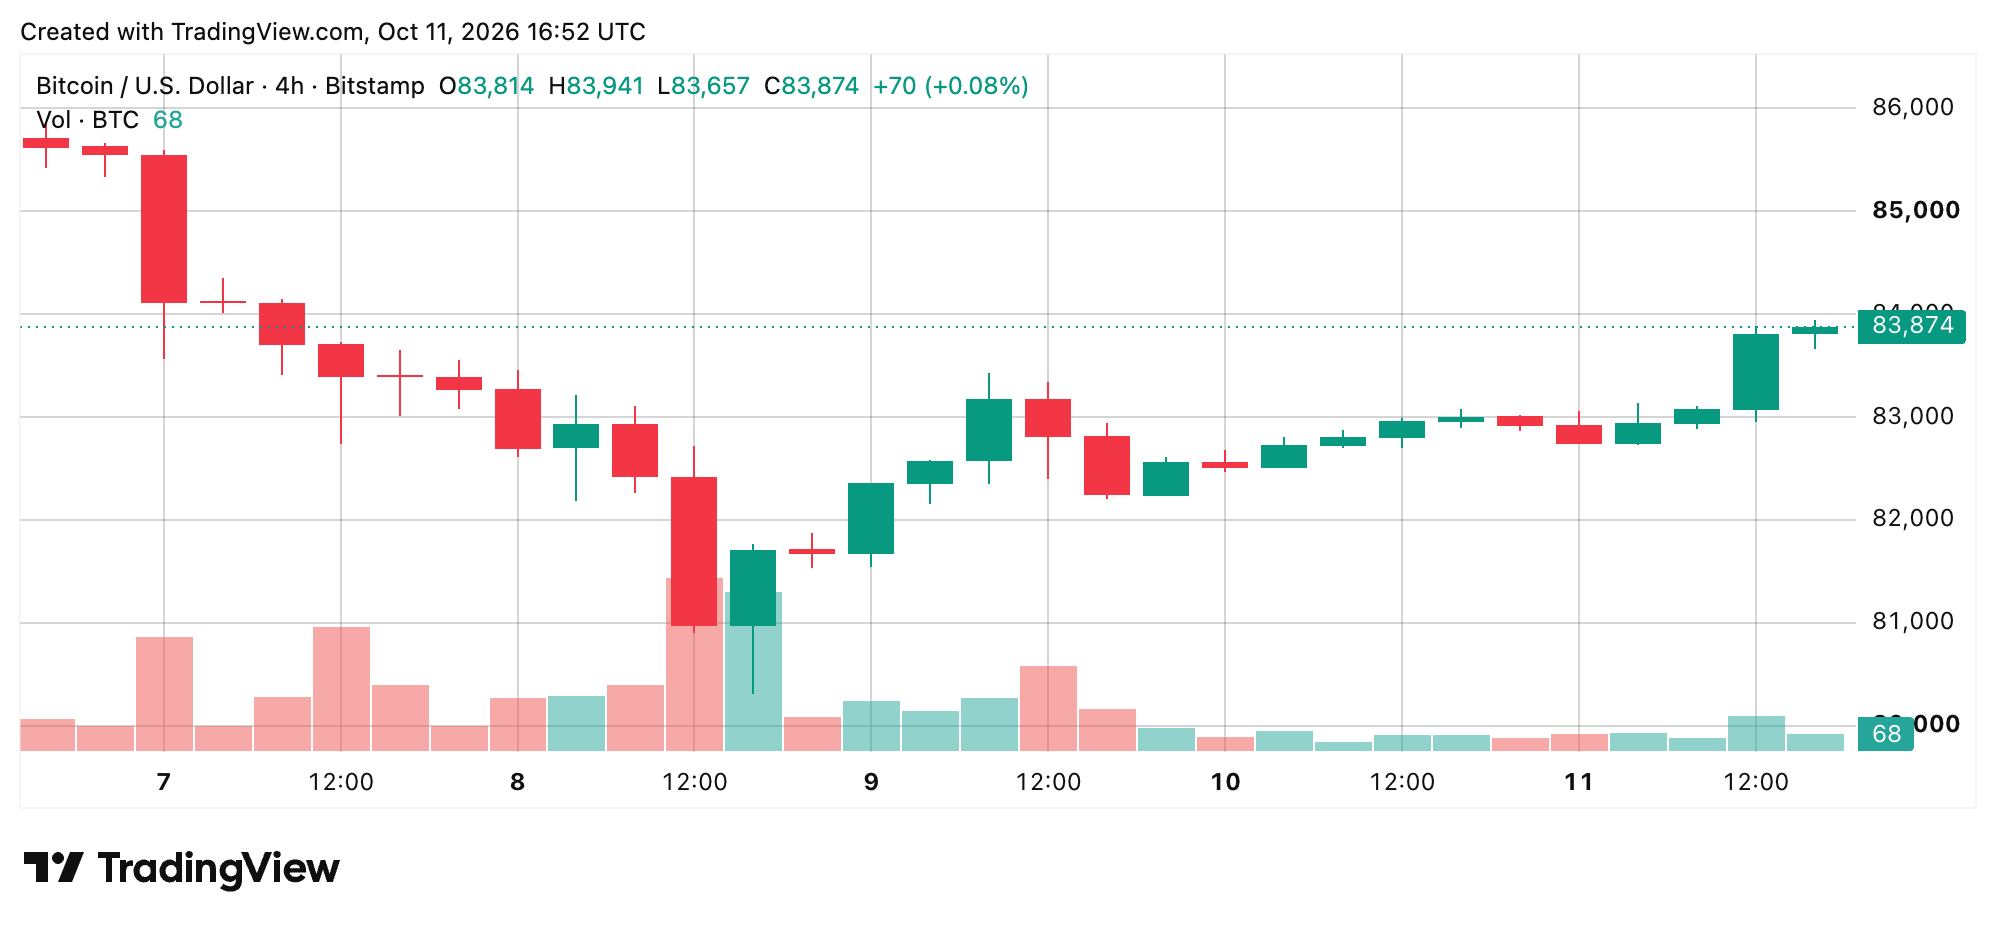
Holding the $83,000 to $83,300 region would preserve the immediate recovery structure, while a retreat beneath $82,500 could expose $81,500. For now, the four-hour configuration suggests improving conditions rather than an established bullish reversal, with momentum still needing to confirm the price recovery.
Daily Chart Keeps the Bigger Picture in Perspective
The daily chart presents a more complicated story, as bitcoin remains below its recent $87,374 peak despite recovering from the $81,000 region. The broader sequence of lower highs has not been decisively broken, leaving the market vulnerable to another reversal if resistance continues to hold.
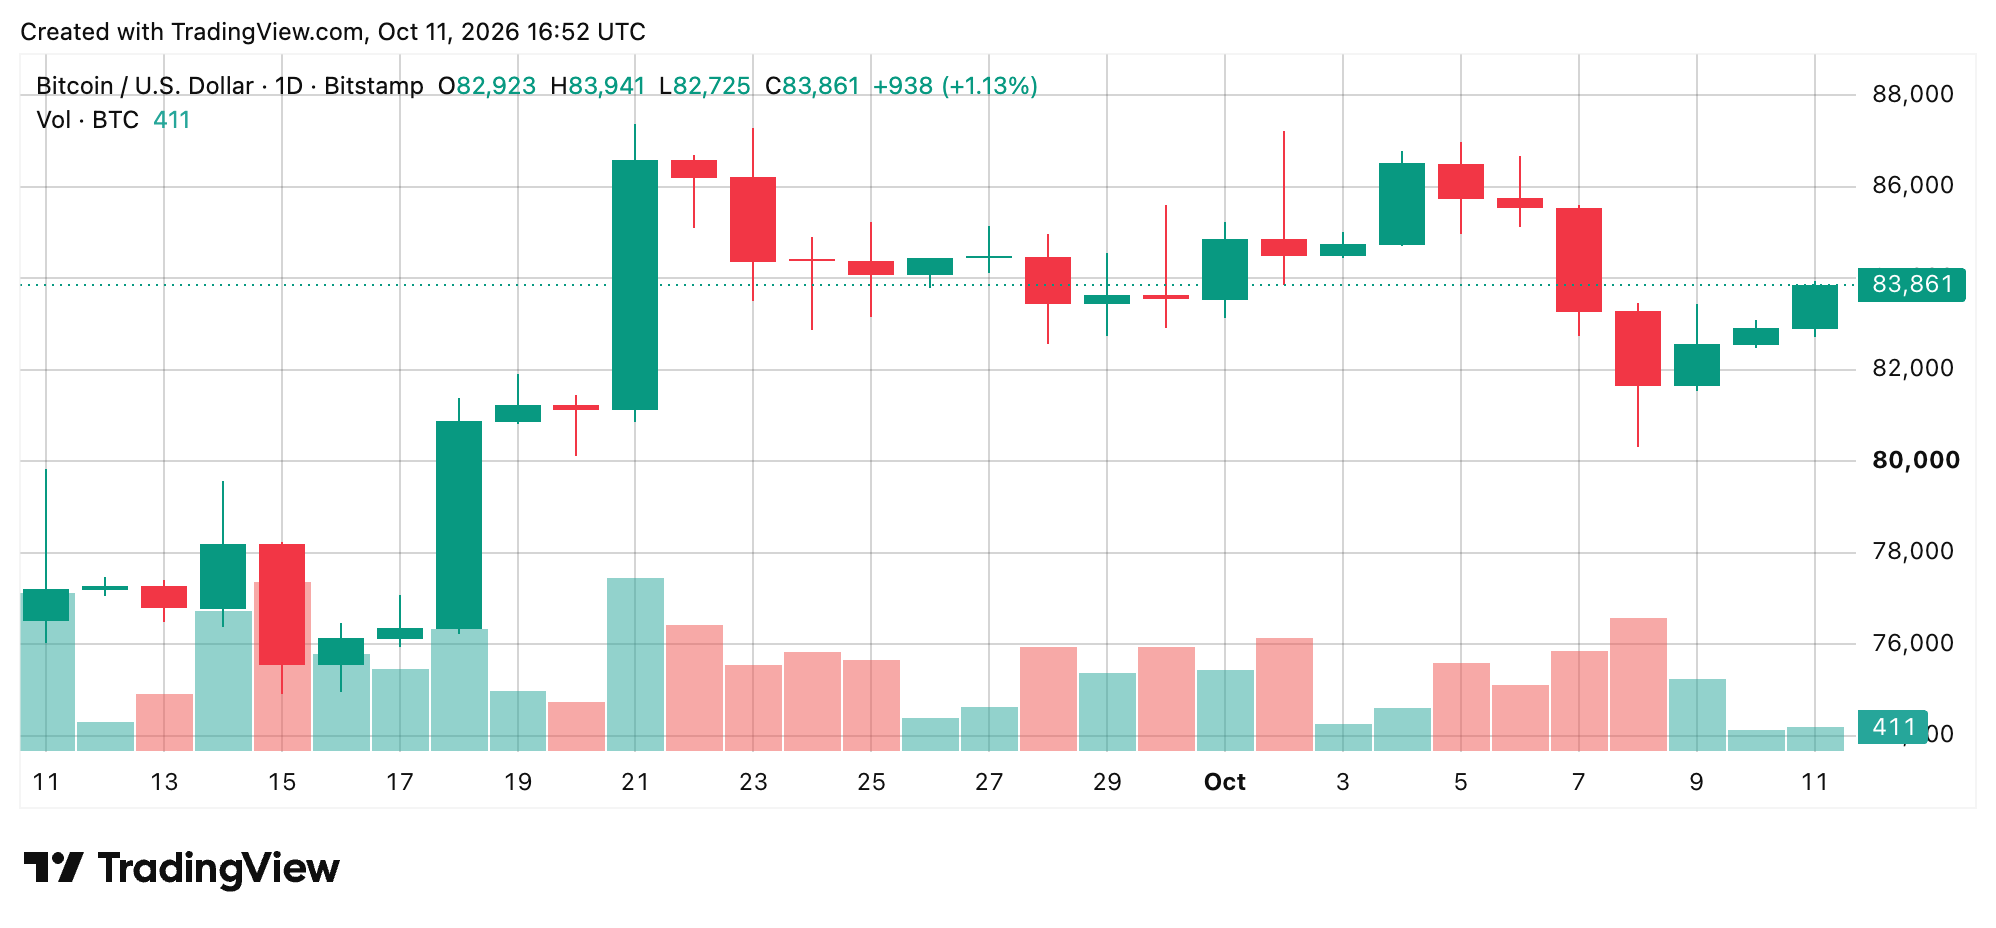
Still, bitcoin’s position above several longer-term moving averages suggests the underlying structure has not deteriorated significantly. Immediate support sits around $82,735, followed by the $82,500 region, while a deeper decline toward $80,900 would place additional pressure on the medium-term outlook.
Oscillators Expose Bitcoin’s Momentum Problem
The daily chart’s oscillator readings are predominantly neutral, with the relative strength index (RSI) registering 52 and Stochastic at 37. The commodity channel index (CCI) stands at negative 94, while the average directional index (ADX) reads 33, indicating meaningful trend strength without establishing its direction.
The Awesome oscillator (AO) registers 944, although momentum at negative 1,832, and the moving average convergence divergence (MACD) at 863 carry negative classifications. Meanwhile, the Stochastic RSI fast sits at 20, Williams at negative 61, the Ultimate oscillator (UO) at 42, and bull bear power at negative 1,158. Collectively, these figures suggest that bitcoin’s recovery has not yet generated convincing momentum confirmation.
Moving Averages Reveal a Divided Market
The moving averages (MAs) offer a particularly interesting contradiction. Bitcoin trades above its 10-period exponential moving average (EMA) at $83,503 and 20-period EMA at $83,193, but remains below the corresponding 10-period simple moving average (SMA) at $84,052 and 20-period SMA at $84,199.
The 30-period EMA at $82,253 and SMA at $82,472 provide additional support, while the 50-period EMA at $79,993 and SMA at $80,928 reinforce the longer-term positive structure. The 100-period and 200-period averages also remain comfortably below the market. Meanwhile, the volume-weighted moving average (VWMA) at $84,164 presents another immediate hurdle, leaving bitcoin sandwiched between improving support and stubborn overhead resistance.
Bull Verdict:
Bitcoin’s recovery remains constructive this weekend while price holds above $83,000, particularly with the 10-period and 20-period EMAs providing underlying support. A sustained advance through $84,200 would strengthen the bullish argument and potentially open the door toward $84,800 and $85,500. Clearing those levels would bring the previous $86,677 high back into consideration, although stronger momentum confirmation would make that scenario more convincing.
Bear Verdict:
Bitcoin’s inability to overcome the $83,900 to $84,200 resistance band leaves the recovery vulnerable to another setback. A retreat beneath $83,000 would weaken the immediate structure, while losing $82,500 could expose $81,500 and eventually the recent $80,308 low. With momentum and MACD still carrying negative classifications, the bearish argument cannot be dismissed, particularly while the daily chart continues to display lower highs.